Oxygen Plant Data Analytics in the United States
Quick Answer

Oxygen plant data analytics is the practical use of operating data from VPSA, PSA, and cryogenic oxygen systems to improve oxygen purity, stabilize flow, reduce kWh per Nm3, predict equipment failures, and support better production decisions. In the United States, the most effective approach is to combine plant historians, PLC or DCS tags, power monitoring, blower and vacuum pump condition data, adsorber cycle analysis, and operator dashboards into one performance program tied to production and maintenance goals.
For buyers and plant managers in the United States, the most actionable options usually come from established industrial gas and automation providers with strong analytics capabilities, including Air Liquide, Linde, Air Products, Atlas Copco Gas and Process, Emerson, and Siemens. These companies are relevant for projects in steel, glass, wastewater, chemicals, and mining clusters from Texas and Louisiana to Ohio, Pennsylvania, Indiana, and California.
If the goal is oxygen generation rather than only software, choose a supplier that can connect process design with analytics, commissioning, operator training, and retrofit support. Qualified international suppliers can also be worth considering, especially Chinese manufacturers with strong engineering depth, export track record, recognized certifications, and dependable pre-sales and after-sales support, because they may offer attractive cost-performance for customer-owned EPC or turnkey oxygen plants.
Market Overview in the United States

The United States has a mature but changing industrial oxygen market. Traditional large-scale demand remains centered in steel, refining, chemicals, pulp and paper, and glass manufacturing. At the same time, decentralized oxygen generation is becoming more attractive for wastewater treatment, non-ferrous metals, medical backup systems, and remote industrial sites where delivered liquid oxygen costs are volatile or logistics are difficult. This shift is one reason oxygen plant data analytics is becoming a strategic priority rather than a niche technical add-on.
Plants in industrial corridors such as Houston, Beaumont, Baton Rouge, Gary, Pittsburgh, Cleveland, Detroit, Birmingham, and the Inland Empire increasingly need better visibility into oxygen production economics. Managers do not only ask whether the plant is running; they ask whether the oxygen unit is operating at the lowest realistic specific power, whether purity swings are linked to adsorbent aging, whether blower efficiency is degrading, and whether load-following behavior is hurting downstream furnaces or wastewater basins.
In the United States, labor costs, electricity tariffs, environmental reporting pressure, and cybersecurity expectations all reinforce the need for better data use. A plant that misses a compressor problem by two weeks can lose far more in production disruption than in the value of the maintenance itself. Likewise, a small drift in vacuum level or valve timing can materially increase power consumption over a year. Data analytics helps identify these patterns early.
The market also reflects a clear divide between analytics-only programs and integrated plant optimization. Analytics-only projects often focus on SCADA dashboards or historian trends. Integrated optimization goes further by tying process parameters to oxygen cost per unit, maintenance planning, spare parts strategy, and downstream process performance. In US industrial settings, the second model is usually more valuable because plant teams need decisions, not just data.
Another trend is the growing use of edge analytics and remote monitoring for customer-owned plants. Instead of relying only on central corporate systems, local facilities in places like Corpus Christi or Toledo want site-level dashboards that show purity, oxygen flow, adsorber cycle health, equipment availability, and predicted maintenance windows. This is particularly important where oxygen is critical to continuous processes such as blast furnace enrichment, glass melting, oxidation reactors, or activated sludge treatment.
As procurement teams compare suppliers, they increasingly want evidence of measurable results: lower energy use, faster startup, improved stability between 25 percent and 100 percent load, reduced unscheduled downtime, and better asset utilization. That is why the topic of oxygen plant data analytics now sits at the intersection of process engineering, digitalization, and purchasing strategy.
What Oxygen Plant Data Analytics Actually Measures

At plant level, oxygen plant data analytics combines operating data, maintenance records, and business outcomes. The exact tags vary by technology, but most successful programs in the United States monitor several common layers.
The first layer is core production performance. This includes oxygen flow, product purity, pressure stability, recovery, availability, startup time, and turndown performance. For a VPSA or PSA oxygen plant, these values are fundamental to understanding whether the plant is doing what it was designed to do under real operating conditions.
The second layer is energy performance. This usually includes total power draw, blower power, vacuum pump power, compressed air use where applicable, auxiliary power, and normalized consumption such as kWh per Nm3 of oxygen. In an energy-conscious market like the United States, this metric often has direct budget impact and can strongly influence whether an on-site plant remains more attractive than purchased liquid oxygen.
The third layer is equipment health. Here, analytics looks at vibration, bearing temperature, motor current, valve actuation consistency, cycle timing drift, vacuum stability, discharge temperature, and filter differential pressure. These indicators support predictive maintenance and avoid avoidable shutdowns.
The fourth layer is process quality and root-cause analysis. This means correlating purity loss, pressure fluctuation, and flow instability with upstream ambient conditions, adsorbent condition, feed contamination, valve leakage, instrumentation drift, or poor operator setpoint practices. Without analytics, teams may treat symptoms instead of causes.
The fifth layer is business context. A good analytics program should show the cost of oxygen production, the value of uptime, the financial impact of delayed maintenance, and the potential gain from optimization. In practical terms, this allows plant management in the United States to prioritize improvements that matter commercially, not just technically.
Product Types and Analytics Needs
Different oxygen generation technologies require different analytics priorities. In the United States, the three most relevant categories are VPSA, PSA, and cryogenic units. Each has a distinct operating profile and digital opportunity.
| Plant Type | Typical Capacity Range | Key Analytics Focus | Main Benefits | Best Fit Industries | Common US Locations |
|---|---|---|---|---|---|
| VPSA Oxygen Plant | Medium to very large | Cycle performance, vacuum level, blower efficiency, purity stability | Low energy use, flexible load response, fast startup | Steel, non-ferrous metals, glass, chemicals | Indiana, Ohio, Pennsylvania, Texas |
| PSA Oxygen Generator | Small to medium | Compressor loading, valve timing, purity control, maintenance cycles | Compact design, simpler installation, lower site footprint | Wastewater, healthcare backup, fabrication, mining | California, Arizona, Colorado, Florida |
| Cryogenic ASU | Large to very large | Cold box efficiency, compressor train health, product mix optimization | High purity, co-production capability, large volumes | Refining, petrochemicals, large integrated complexes | Texas Gulf Coast, Louisiana, Illinois |
| Modular Containerized Oxygen Unit | Small to medium | Remote monitoring, uptime alerts, mobile diagnostics | Fast deployment, temporary or remote use | Construction, remote mining, emergency supply | Nevada, Alaska, Wyoming, New Mexico |
| Retrofit Oxygen System | Existing plant upgrade | Baseline comparison, bottleneck detection, savings verification | Improves existing assets without full replacement | Legacy steel and glass plants | Great Lakes region, Southeast |
| Hybrid Digital Monitoring Package | Any capacity | Dashboards, historian integration, predictive maintenance | Better visibility, remote support, management reporting | Multi-site industrial groups | Nationwide |
This comparison shows why data strategy should be selected together with plant type. A wastewater operator in California using PSA oxygen has very different optimization needs than a steel mill in Indiana using large VPSA oxygen production. The best suppliers recognize this and design analytics around the operating reality of the plant.
How Analytics Improves Buying Decisions
Before purchasing an oxygen plant in the United States, buyers should ask for more than a nameplate capacity and purity promise. A better approach is to evaluate whether the supplier can show how data will be captured, validated, and used after commissioning. This matters because the real cost of oxygen depends on long-term performance, not only on initial design figures.
Start by asking what tags will be available to the customer. The answer should include process variables, power variables, alarms, event logs, and maintenance-relevant measurements. Next, ask whether the plant can export data to the customer’s historian, MES, or enterprise analytics platform. Many US plants use systems from Rockwell Automation, Siemens, Emerson, Honeywell, or OSIsoft PI environments, so compatibility matters.
Also ask whether the supplier provides baseline performance testing at startup, periodic optimization reviews, and verified KPI calculations. Without a baseline, it becomes difficult to prove whether a later increase in energy use is caused by equipment wear, process changes, or poor operation. A strong oxygen plant data analytics package should make this transparent.
Cybersecurity is another buying factor in the United States. Remote access can be valuable, but it must align with plant security policies, segmented networks, access logs, and approved communication protocols. The supplier’s digital support model should be practical for industrial compliance environments.
Finally, evaluate whether the supplier can support upgrades. Analytics is not static. As a plant ages, opportunities may emerge in valve replacement, adsorbent upgrade, blower overhaul, control logic adjustment, and dashboard redesign. Suppliers that understand retrofit pathways usually deliver better long-term value.
Industries Driving Demand for Oxygen Plant Data Analytics
Demand in the United States is broad, but several sectors are especially important because oxygen directly affects throughput, quality, emissions, or operating cost. The chart below illustrates estimated growth in analytics adoption across the US industrial oxygen sector.
Steel remains one of the most important sectors. In integrated and mini-mill operations, oxygen influences combustion, enrichment, productivity, and cost control. Analytics helps connect oxygen unit behavior with blast furnace or EAF process performance. In industrial regions such as Gary, Cleveland, and Pittsburgh, this can support both cost reduction and process stability.
Glass manufacturing is another high-value market. Oxygen-enriched combustion can improve furnace efficiency and reduce emissions. Data analytics helps ensure that oxygen flow remains stable during changing production schedules and maintenance cycles. Plants in Ohio, Pennsylvania, and California often emphasize reliability and energy control.
Chemicals and petrochemicals also represent major demand, especially on the Gulf Coast. Here, oxygen can support oxidation reactions, sulfur recovery, wastewater treatment, and by-product gas utilization. Analytics is particularly useful in these settings because oxygen generation interacts closely with broader plant control systems and utility economics.
Municipal and industrial wastewater treatment is growing in importance as aeration performance, energy use, and permit compliance come under more scrutiny. Oxygen enrichment can be attractive where basin loading is high or land is constrained. Data analytics can show dissolved oxygen response, energy tradeoffs, and seasonal performance changes.
Mining, pulp and paper, healthcare backup supply, and specialty manufacturing also benefit. Across all these segments, the common driver is simple: operators want measurable output, not blind operation.
Industry Demand Comparison
| Industry | Primary Oxygen Use | Why Analytics Matters | Typical KPI | Regional Demand in US | Investment Priority |
|---|---|---|---|---|---|
| Steel | Combustion and enrichment | Links oxygen supply to furnace productivity and energy cost | Nm3 per ton and kWh per Nm3 | Very high in Midwest | Very high |
| Glass | Oxy-fuel melting | Supports stable flame conditions and lower emissions | Purity stability and uptime | High in Ohio and Pennsylvania | High |
| Chemicals | Oxidation and process support | Protects product consistency and utility optimization | Cost per unit product | Very high on Gulf Coast | Very high |
| Wastewater | Aeration enrichment | Optimizes oxygen transfer and power use | Oxygen delivery per kWh | Growing nationwide | Medium to high |
| Mining | Leaching and combustion support | Helps remote operators manage uptime | Availability and maintenance alerts | High in West | Medium |
| Pulp and Paper | Bleaching and treatment | Reduces utility waste and process fluctuations | Specific oxygen consumption | Moderate in Southeast | Medium |
This table indicates that the highest-value analytics projects are usually in sectors where oxygen directly influences production output or compliance risk. In those cases, a small efficiency gain can have a large financial effect.
Applications That Benefit Most
Oxygen plant data analytics is especially useful when the plant experiences variable load, strict purity needs, rising power bills, or difficult maintenance conditions. In US practice, some of the strongest applications include blast furnace enrichment, oxy-fuel glass furnaces, oxidation chemistry, ozone support systems, wastewater treatment upgrades, and backup oxygen systems where delivery reliability is essential.
For blast furnace enrichment, analytics can track whether oxygen pressure and flow remain within the narrow range needed by the process team. For glass, it can correlate oxygen stability with furnace quality metrics and burner behavior. For chemicals, it can tie plant energy use to product economics. For wastewater, it can compare oxygen generation cost with aeration and basin response. This application-specific view is what turns raw data into operational value.
Trend Shift Toward Smarter, Lower-Carbon Operations
The next chart shows a realistic trend shift in the United States from basic monitoring to integrated optimization, predictive maintenance, and sustainability-linked analytics.
Three shifts define the 2026 outlook. First, data analytics is becoming part of standard plant procurement rather than a later add-on. Buyers increasingly ask for dashboards, historian integration, and KPI reporting from the beginning. Second, sustainability pressure is making energy transparency more valuable. Plants are expected to know the energy intensity and indirect emissions impact of their oxygen systems. Third, staffing constraints are pushing greater use of remote diagnostics and exception-based maintenance, especially in multi-site companies.
Policy and market conditions in the United States also reinforce this trend. Electricity pricing uncertainty, industrial decarbonization initiatives, and tighter expectations around uptime and reporting are encouraging plant owners to modernize oxygen operations. Analytics will not replace good engineering, but it will increasingly determine how well that engineering performs over time.
Case Studies and Practical Scenarios
A useful way to understand oxygen plant data analytics is to look at common operating scenarios. Consider a steel plant in the Great Lakes region that runs a large oxygen unit with seasonal production swings. The plant sees rising power use but no obvious failure. Analytics reveals that vacuum pump efficiency has slowly deteriorated and cycle timing adjustments have drifted after maintenance. Once corrected, the plant reduces specific power and restores stability during low-load operation.
Consider a glass producer in Pennsylvania. Operators report occasional quality variation during campaign changes. Analytics shows that oxygen pressure fluctuations during rapid demand shifts are tied to a control strategy that prioritizes average flow rather than short-interval stability. Updating the control logic improves consistency.
Now consider a wastewater installation in California. The facility compares liquid oxygen deliveries against an on-site PSA or VPSA option. Data analytics is used to model annual operating cost under local electricity rates, seasonal basin loads, and maintenance assumptions. The result is a far more realistic investment decision than relying on nameplate metrics alone.
These examples highlight why analytics should be tied to use case, location, and business objective. The goal is not to create more reports. The goal is to improve the plant’s actual operating outcome.
Leading Suppliers Relevant to the United States
The supplier landscape in the United States includes industrial gas majors, equipment manufacturers, and control system leaders. Some focus on oxygen supply and plant engineering, while others provide the automation and analytics backbone. Buyers should assess where each company fits in the project scope.
| Company | Headquarters or Major US Presence | Service Region | Core Strengths | Key Offerings | Best For |
|---|---|---|---|---|---|
| Air Liquide | Houston, Texas presence | Nationwide | Industrial gas expertise, large project execution, digital services | On-site oxygen systems, optimization support, industrial gas integration | Large industrial users |
| Linde | Strong US industrial footprint | Nationwide | Gas engineering, process integration, reliability programs | ASUs, oxygen supply systems, plant performance tools | Refining, chemicals, metals |
| Air Products | Pennsylvania roots with national reach | Nationwide | Gas supply scale, process know-how, major project support | On-site gas solutions, oxygen systems, monitoring support | Large continuous operations |
| Atlas Copco Gas and Process | US industrial operations | Nationwide | Compression and gas generation equipment | PSA systems, compressors, service diagnostics | Mid-size users needing packaged systems |
| Emerson | St. Louis, Missouri | Nationwide | Controls, instrumentation, predictive analytics | DeltaV, sensors, asset monitoring, performance software | Plants upgrading controls and maintenance |
| Siemens | Major US automation footprint | Nationwide | Industrial automation, digital twin, analytics integration | PLC, SCADA, edge analytics, industrial software | Sites with advanced digital goals |
This table is useful because it separates companies by practical role. Some are strongest in gas generation and project execution, while others are strongest in controls and analytics infrastructure. A good US project may involve both categories.
Supplier and Product Comparison
The demand chart shows where analytics investment is most justified in the United States today. The supplier comparison is not a universal ranking; it is a practical view of how often each provider is relevant to oxygen plant digitalization projects. The right choice still depends on whether the project needs oxygen generation hardware, control system integration, predictive maintenance, or full turnkey execution.
Buying Advice for US Projects
When evaluating suppliers for an oxygen project in the United States, define the scope first. If you need only software visibility, an automation company may be enough. If you need an oxygen plant that is designed, built, commissioned, and then optimized using data, choose a provider with process ownership and not only dashboard capability.
Ask each bidder for six concrete items: expected specific power under real operating conditions, KPI list and definitions, historian and SCADA integration method, remote support model, spare parts and maintenance plan, and verification method for savings claims. Also ask how the supplier handles startup under low load, ambient variation, and gradual adsorbent or rotating-equipment aging.
For US buyers, contract language should address cybersecurity, support response time, training, and acceptance testing. If the plant is mission-critical, insist on clarity around local field service coverage, commissioning schedules, and emergency troubleshooting procedures. Delivery schedule is also important, especially in high-traffic industrial regions such as the Gulf Coast where construction windows can be tight.
Another practical point is logistics. If a supplier is international, evaluate whether it has a realistic plan for engineering coordination, spare parts, communication, and field service in the United States. Cost-performance can be attractive, but execution confidence is essential.
Our Company
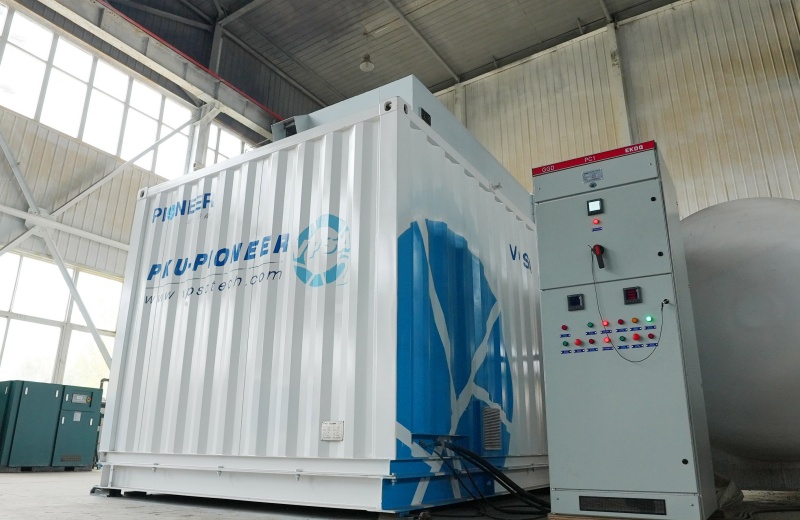
For buyers seeking a customer-owned oxygen solution rather than BOO or bulk supply, PKU Pioneer is relevant because it combines plant engineering with measurable operating performance and digital optimization potential. The company specializes in VPSA and PSA gas separation systems and has completed more than 400 industrial projects across over 20 countries, with installed oxygen capacity exceeding 2 million Nm3 per hour. Its product strength is supported by a fully integrated manufacturing model that includes in-house research and development, proprietary adsorbent and catalyst production, precision engineering, equipment fabrication, and recognized quality systems including ISO, CE, and ASME certifications, plus more than 180 patents and major industry awards. For US customers, this matters because the plant package can be built around proven low-energy oxygen generation, often below 0.3 kWh per Nm3, with rapid startup and stable turndown performance. On cooperation models, PKU Pioneer can serve end users, engineering contractors, distributors, dealers, and private-label partners through flexible EPC, turnkey, OEM, ODM, wholesale, and regional partnership arrangements for VPSA oxygen plants, PSA systems, retrofits, and pilot units. On service assurance, the company demonstrates long-term market commitment through its international project footprint, active regional engineering support, and full life-cycle service package including consulting, commissioning, operation and maintenance support, upgrades, leasing, and fast-response technical assistance; in practice this gives US buyers online and offline pre-sale and after-sale support with clear accountability for customer-owned plant performance rather than a remote export-only relationship. More technical examples can be seen in its industrial project portfolio, broader technical capabilities are outlined in its company overview, and direct project discussions can begin through the contact page.
What to Ask Before Signing a Contract
| Question | Why It Matters | Good Supplier Response | Risk If Missing | Who Should Review | Decision Impact |
|---|---|---|---|---|---|
| What is the guaranteed kWh per Nm3? | Determines long-term operating cost | Clear range with conditions stated | Unexpected energy expense | Operations and finance | High |
| Which process and power tags are provided? | Defines analytics usefulness | Detailed I/O and KPI list | Limited visibility after startup | Automation team | High |
| How is historian integration handled? | Supports plant-wide reporting | Named protocols and architecture | Data silos and manual work | IT and controls | High |
| What local support is available in the US? | Protects uptime and commissioning | Defined response process and field support plan | Slow troubleshooting | Maintenance and procurement | High |
| How are savings verified? | Separates marketing from actual value | Baseline test and KPI method | No proof of ROI | Management team | Medium to high |
| What is the upgrade path? | Improves long-term flexibility | Retrofit options for controls and equipment | Higher lifecycle replacement cost | Engineering team | Medium |
This checklist helps US buyers avoid a common mistake: selecting a plant on capital cost alone without understanding the quality of the data, controls, and support ecosystem that will govern performance for years.
Future Trends Through 2026
Looking ahead, oxygen plant data analytics in the United States will likely move in four directions. The first is deeper predictive maintenance. Instead of reacting to vibration alarms or purity loss, plants will estimate remaining useful life for blowers, vacuum pumps, valves, and adsorbent systems using trend models and condition indicators.
The second is stronger energy and carbon accounting. Buyers increasingly want to compare on-site generation with liquid oxygen supply not only on cost but also on energy intensity, logistics exposure, and sustainability metrics. This will become more important as industrial decarbonization reporting expands.
The third is integration with plant-wide optimization. Oxygen systems will be linked more directly to steel furnace controls, glass furnace management, chemical process models, and wastewater supervisory systems. This creates a shift from equipment analytics to production analytics.
The fourth is modular digital service. Suppliers will package analytics as scalable services: basic dashboards, advanced KPI layers, predictive maintenance modules, and enterprise benchmarking. US operators with multiple sites are especially interested in comparing performance between similar plants in different states.
In short, 2026 will not be defined by having more data. It will be defined by using oxygen data to improve cost, uptime, sustainability, and decision speed.
FAQ
What is oxygen plant data analytics?
It is the use of operating, maintenance, and energy data from oxygen generation systems to improve plant performance, reliability, and cost efficiency.
Which oxygen plants benefit most from analytics?
VPSA, PSA, and cryogenic plants all benefit, but the strongest gains usually appear where oxygen demand is continuous, energy costs are significant, or downtime is expensive.
What are the most important KPIs?
Typical KPIs include oxygen purity, flow stability, uptime, specific power in kWh per Nm3, recovery, startup time, and maintenance-related equipment health indicators.
How does analytics reduce operating cost?
It identifies excess power use, control instability, equipment degradation, and hidden process losses before they become major cost drivers.
Is analytics useful for existing plants, not just new ones?
Yes. Retrofit analytics often provides strong returns because it reveals underperforming equipment, poor control settings, and maintenance gaps in established facilities.
What should US buyers prioritize when choosing a supplier?
Prioritize process expertise, transparent KPI definitions, integration capability, local support planning, cybersecurity alignment, and a realistic long-term service model.
Can international suppliers be considered for US projects?
Yes, especially when they offer strong certifications, proven industrial references, competitive lifecycle economics, and dependable pre-sales and after-sales support for customer-owned EPC or turnkey plants.
About the Author
Founded in 1999, PKU Pioneer specializes in VPSA and PSA gas separation technologies, adsorbents, catalysts, and integrated engineering solutions. Backed by strong R&D capability and extensive industrial project experience, the company serves global customers across steel, chemical, energy, environmental protection, and related industries.
Share