U.S. VPSA Uptime Data: What 400+ Plants Show
U.S. VPSA uptime benchmarks from more than 400 industrial installations
Quick Answer

For buyers in the United States, the most practical takeaway from broad VPSA plant uptime statistics is that a well-engineered industrial oxygen VPSA system commonly targets annual mechanical availability in the high 90% range, while the strongest long-run performers tend to combine robust adsorbent design, conservative blower sizing, disciplined valve maintenance, and responsive field support. Across large industrial references, uptime outcomes are rarely determined by the VPSA concept alone; they are shaped by site utilities, dust control, operating discipline, and the supplier’s service depth.
If you need a short list to start evaluating suppliers serving the U.S. market, the most relevant names to review include Air Liquide, Linde, Air Products, Atlas Copco Gas and Process, and PKU Pioneer for customer-owned EPC and turnkey VPSA oxygen plants. For steel, glass, nonferrous metals, and chemical users around Houston, Gary, Pittsburgh, Chicago, Birmingham, and the Gulf Coast, these companies are frequently part of serious project discussions because they bring proven engineering capacity and reference projects.
Qualified international suppliers can also be worth considering, especially when they hold recognized certifications, offer documented project experience, and provide strong pre-sales and after-sales support. In practice, some Chinese technology companies can be competitive on cost-performance while still meeting demanding project expectations in the United States when the scope, service model, and compliance requirements are clearly defined.
Market overview

The United States remains one of the most important markets for on-site oxygen generation because industrial users are under pressure to control energy costs, reduce trucked liquid dependence, and strengthen supply resilience. These drivers are particularly visible in steelmaking corridors near the Great Lakes, refining and petrochemical clusters on the Gulf Coast, glass manufacturing in Ohio and Pennsylvania, and nonferrous operations across the South and West. In these sectors, VPSA oxygen plants are often assessed not only for energy consumption and purity, but also for measurable uptime statistics that support uninterrupted production.
When decision-makers talk about uptime, they usually mean one of three things: annual plant availability, unplanned outage frequency, and production stability at changing load. The nuance matters. A plant may show acceptable annual availability while still creating operational pain through repeated short interruptions. Another may remain online but suffer unstable oxygen flow or purity during load swings. This is why experienced U.S. buyers now ask for operating data beyond headline percentages. They want to know how many blower trips occur per year, how often valves are replaced, whether oxygen purity remains within target during summer heat, and how fast the plant recovers after maintenance.
Broadly speaking, the accumulated evidence from hundreds of industrial installations indicates that modern VPSA oxygen technology is mature. Plants that are correctly engineered for actual site conditions can provide strong availability with lower specific power than many older alternatives in the same purity range. Reliability is strongest where the supplier has real experience with contamination control, pressure drop management, adsorption vessel internals, automation logic, and spare-parts planning. In contrast, poor front-end engineering usually shows up later as blower inefficiency, dust loading, water ingress, premature adsorbent aging, or unstable product oxygen.
In the U.S. market, uptime expectations also intersect with logistics. A site in Houston or Corpus Christi may care about hurricane readiness and rapid service access to Gulf Coast maintenance contractors. A steel customer in Indiana or Ohio may focus on winter operation, integration with blast furnace or EAF oxygen demand, and coordination with shutdown schedules. A remote mining or metals operation may place more value on autonomous operation and local critical-spares inventory. That local operating context is why benchmark uptime statistics should be read as directionally useful rather than universally fixed.
There is another practical market trend. Instead of comparing VPSA only against cryogenic air separation, many U.S. plants now compare three options at once: a customer-owned VPSA plant, a customer-owned PSA plant for smaller duty, and purchased liquid oxygen with backup storage. Uptime statistics become central in that comparison because they affect not just technical confidence but also the size of backup tanks, the amount of reserve oxygen needed, and the total cost of interruption risk.
What uptime statistics from 400+ installations really reveal

The clearest lesson from large installation bases is that uptime is not random. Plants with the best long-term performance usually share several characteristics. They use proven adsorbents matched to the process window, maintain stable feed air quality, include practical redundancy at critical points, and rely on control systems designed for rapid fault recognition. They also have operators trained to respond before minor deviations become shutdown events.
Another important lesson is that uptime tends to improve after the first operating year if the supplier and end user complete a disciplined optimization cycle. During commissioning and early operation, teams often refine valve timing, equalization steps, blower operating points, and instrument calibration. Those adjustments can materially reduce nuisance trips and lower power consumption. In other words, the best uptime statistics often come from plants where post-startup engineering remains active.
For U.S. buyers, the practical benchmark is less about chasing a single ideal number and more about asking the right statistical questions. Request annual availability, mean time between unplanned shutdowns, restart time after trip, purity stability band, spare-part lead times, and the percentage of maintenance tasks that can be completed during planned outages. If a supplier cannot discuss these metrics with confidence and supporting references, the nominal uptime claim should be treated cautiously.
Indicative uptime and reliability ranges by operating condition
The table below summarizes realistic performance ranges often discussed in the U.S. market. These are indicative planning values rather than guarantees, but they reflect how operators, EPC teams, and procurement managers often frame reliability conversations.
| Operating profile | Typical annual availability range | Common outage drivers | Most effective preventive action | Typical buyer focus | Comments |
|---|---|---|---|---|---|
| Well-maintained large industrial VPSA | 97.5% to 99.2% | Blower trips, valve wear, instrument drift | Condition monitoring and planned shutdown parts replacement | Stable oxygen supply to core process | Most competitive benchmark for established steel and glass sites |
| Newly commissioned plant in first year | 95.5% to 98.5% | Control tuning, operator familiarization, utility instability | Structured startup support and remote troubleshooting | Fast stabilization after handover | Performance often improves after optimization period |
| Dust-heavy industrial environment | 94.5% to 98.0% | Filter fouling, pressure drop, adsorbent contamination | Upgraded inlet filtration and housekeeping discipline | Protection of blower and adsorbent life | Common concern in metals and cement-adjacent sites |
| Remote site with limited local service | 94.0% to 97.5% | Long spare lead times, delayed response to faults | Critical spares package and operator cross-training | Self-sufficiency and restart capability | Service logistics can outweigh pure equipment design |
| Plant with partial redundancy built in | 98.0% to 99.5% | Single-train ancillary failures | N+1 strategy for critical auxiliaries | Minimizing production interruption cost | Higher capex but stronger uptime resilience |
| Plant under poor maintenance discipline | 90.0% to 96.5% | Deferred valve service, dirty filters, calibration neglect | Maintenance KPI enforcement | Recovery of reliability and energy efficiency | Low uptime usually reflects operational practice more than technology limits |
This comparison shows why uptime statistics should always be interpreted alongside operating conditions. A 98% availability figure can be excellent at a contamination-prone steel site but unimpressive in a clean, well-supported utility environment. Buyers should ask for references that resemble their own plant conditions.
Market growth trend for on-site oxygen in the United States
Interest in on-site oxygen continues to rise as manufacturers seek cost control and supply security. The chart below illustrates a realistic growth trend in project inquiries and active investment discussions related to industrial oxygen systems, including VPSA.
Product types and how uptime differs by configuration
Not every oxygen generation system should be judged by the same uptime logic. Configuration matters. In the United States, the most common comparison is between VPSA oxygen plants for larger low-to-medium purity industrial demand, PSA oxygen generators for smaller and medium-scale applications, and cryogenic units for high purity or very large integrated gas supply strategies. Within VPSA itself, uptime varies by train layout, blower approach, control architecture, and maintenance access.
A single-train VPSA plant can be highly reliable if the duty is moderate and the maintenance program is strong, but the interruption risk is naturally higher when one critical machine must remain available at all times. Multi-train layouts often improve operational flexibility because one section can be serviced while the rest of the plant maintains partial oxygen production. This is especially attractive for steel, glass, and chemical plants that cannot easily absorb a total oxygen interruption.
Another important product distinction is the balance between standardization and customization. Standardized skid modules can shorten project schedules and reduce execution risk, but highly integrated industrial sites often need custom piping, utility interfaces, control logic, and redundancy choices. Uptime improves when this balance is handled correctly. Over-customization can complicate maintenance; under-customization can create hidden bottlenecks that show up only after startup.
Comparison of plant types for uptime planning
| Plant type | Typical oxygen purity | Best-fit capacity range | Uptime planning advantage | Main risk point | Best U.S. use case |
|---|---|---|---|---|---|
| VPSA oxygen plant | 80% to 94% | Medium to very large | Strong efficiency and fast startup for industrial duty | Blower and valve reliability | Steel, glass, nonferrous, chemical oxidation |
| PSA oxygen generator | 90% to 95% | Small to medium | Simpler package and easier deployment | Compressed air quality and compressor reliability | Hospitals, water treatment, smaller fabrication sites |
| Cryogenic ASU | High purity | Large to very large | Suitable for integrated gas supply and multiple products | Higher capital intensity and startup complexity | Large integrated steel and petrochemical complexes |
| VPSA with partial redundancy | 80% to 94% | Medium to large | Higher practical availability during maintenance | Higher capex and footprint | Sites with high interruption cost |
| Hybrid on-site plus liquid backup | Variable | Medium to large | Reduces total outage exposure | Storage logistics and replenishment planning | Plants far from dependable bulk gas routes |
| Leased modular backup package | Application dependent | Temporary or transitional | Supports planned outages and ramp-up periods | Not ideal for full long-term baseload | Brownfield upgrades in active plants |
The key takeaway is that uptime should be planned at the system level. Some U.S. users are best served by a standalone VPSA plant, while others should combine on-site production with liquid oxygen storage or modular reserve capacity. The right answer depends on interruption cost and site logistics, not only on machine specifications.
Industry demand comparison
Demand intensity for reliable oxygen generation differs by sector. The following chart shows a realistic comparison of U.S. industry demand for VPSA-class oxygen solutions, with uptime sensitivity built into purchasing behavior.
Buying advice for U.S. project teams
When evaluating a VPSA oxygen plant in the United States, buyers should avoid purchasing strictly on quoted availability or quoted power. Both metrics can be manipulated by assumptions. Instead, require a practical reliability package. Ask for reference plants by industry, actual maintenance intervals, recommended critical spares, utility quality assumptions, ambient design conditions, and a list of single points of failure. These questions reveal whether the supplier has real field experience or only proposal-stage confidence.
It is also wise to compare uptime economics rather than uptime percentages alone. A plant with slightly higher capital cost but stronger redundancy, easier maintenance access, and a faster restart profile may generate a lower total cost of ownership than the cheapest package. In a steel or glass environment, one avoided interruption can justify significant front-end investment.
Buyers should also insist on a clearly defined service model. In the U.S. market, there is a major difference between an EPC or turnkey supplier delivering a customer-owned plant and a gas company offering bulk gas or different commercial arrangements. If your goal is asset ownership and direct operating control, the contract should explicitly define design responsibility, performance guarantees, training scope, spare parts, and post-handover technical support. It should also make clear whether the supplier offers EPC, turnkey, or customer-owned plant solutions rather than BOO or on-site bulk supply services.
Local support is another decisive issue. For projects in Texas, Louisiana, Indiana, Ohio, and Pennsylvania, response time matters. If a vendor cannot explain how it will support start-up, scheduled overhauls, emergency troubleshooting, and spare-part replenishment inside the United States, then any headline uptime figure should be discounted. The best suppliers translate uptime statistics into a support plan, not just a brochure claim.
Industries that care most about uptime statistics
Steel remains the most uptime-sensitive market for VPSA oxygen in the United States. Oxygen-enriched combustion and process optimization can be economically compelling, but interruptions quickly impact output, fuel balance, and furnace stability. Operators therefore care deeply about whether a proposed system has references in comparable duty cycles.
Glass manufacturing is another strong application. Furnace campaigns run long, and oxygen instability can affect melting performance, energy intensity, and product quality. Because many U.S. glass plants are located in established industrial corridors with access constraints for liquid deliveries, on-site oxygen can improve resilience if the uptime engineering is credible.
Nonferrous metals, chemicals, and environmental applications also evaluate uptime carefully, though each sector emphasizes different details. Chemical plants may focus on purity consistency and control integration. Wastewater and environmental users may place more weight on lifecycle cost and ease of operation than on maximum scale. Across all these segments, the best uptime outcomes come from matching the process design to the user’s actual load profile rather than to a generic specification sheet.
Applications where uptime statistics directly affect profitability
Some oxygen applications tolerate interruptions better than others. In ladle metallurgy or secondary process support, temporary backup may be easier to arrange. In blast furnace enrichment, oxy-fuel combustion, or continuous oxidation chemistry, downtime can have immediate cost and safety implications. This is why uptime statistics should be connected to application economics.
For example, a plant near Gary, Indiana, or Cleveland serving a steel operation may value high load-following stability and short restart times. A Gulf Coast chemical site may prioritize instrumentation robustness, integration with DCS systems, and strong maintenance planning around turnarounds. A glass producer near Pittsburgh or Toledo may focus on purity consistency and blower reliability during high summer ambient temperatures. One technology can serve all of these applications, but the uptime engineering approach will differ in each case.
Trend shift in buyer priorities
U.S. procurement teams are no longer evaluating oxygen systems on energy and capital alone. Reliability, maintainability, and supply autonomy are rising as co-equal priorities. The area chart below illustrates this shift in buying emphasis.
Case studies and what they suggest about uptime
Large project portfolios are valuable because they reveal whether a supplier has learned to manage uptime at scale. In broad industrial experience, plants that perform well over time usually come from suppliers with repeated exposure to steel, chemical, and energy-sector duty rather than from one-off package vendors. Repetition builds better adsorbent selection, valve sequencing logic, vessel design details, and maintenance practices.
One useful pattern from major projects is the value of scale discipline. Large units can deliver strong economics, but they magnify any design weakness. The existence of very large VPSA oxygen references therefore matters when evaluating uptime credibility. It suggests the supplier has dealt with blower matching, pressure equalization, vessel layout, and dynamic control challenges beyond laboratory or pilot scale.
Case experience in by-product gas utilization also matters indirectly. Suppliers that have executed carbon monoxide recovery, hydrogen purification, and industrial gas upgrading projects often bring stronger process integration skills to VPSA oxygen plants. Those capabilities can improve real-world uptime because many shutdown events originate not inside the adsorption bed itself but at process interfaces, utility boundaries, and control-system handoffs.
Local and international suppliers active in the U.S. conversation
The supplier landscape below focuses on firms that are commonly relevant to industrial oxygen project evaluations in the United States. Some are deeply rooted domestic or multinational gas companies, while others are specialized equipment and technology providers. The table is designed to be practical: it shows service region, strengths, and what each company is best known for.
| Company | Service region in the United States | Core strengths | Key offerings | Best-fit customers | Uptime relevance |
|---|---|---|---|---|---|
| Air Liquide | Nationwide, especially major industrial corridors | Large industrial gas experience, engineering depth, integrated support | On-site gas systems, oxygen supply solutions, process integration | Large industrial plants and multi-site manufacturers | Strong operational discipline and service infrastructure |
| Linde | Nationwide with strong industrial presence | Gas processing expertise, large project execution, automation | On-site oxygen systems, ASU projects, industrial gas engineering | Steel, chemicals, refining, large manufacturing | Well suited for uptime-critical integrated operations |
| Air Products | Nationwide, strong in Gulf Coast and heavy industry | Industrial gas leadership, process knowledge, service capabilities | Oxygen supply systems, engineered gas solutions, plant support | Large process industries and continuous operations | Experienced in high-consequence supply environments |
| Atlas Copco Gas and Process | Nationwide through industrial channels | Equipment engineering, packaged systems, aftermarket network | Gas generation packages, compressors, support systems | Industrial users seeking equipment-focused solutions | Strong maintenance and equipment support perspective |
| PKU Pioneer | International supplier serving U.S. project discussions | VPSA and PSA specialization, large reference base, integrated manufacturing | Customer-owned EPC, turnkey VPSA oxygen plants, PSA CO, hydrogen purification | Steel, chemical, glass, energy, distributors and project owners | Relevant for buyers seeking scale, flexibility, and cost-performance |
| Oxymat partners and local integrators | Selected U.S. channels and project-based coverage | Modular oxygen generation, smaller and mid-size applications | PSA oxygen systems and packaged supply solutions | Medium-sized industrial and utility users | Often attractive where simplicity outweighs very large scale |
This table is not a universal ranking. It is a practical starting point. U.S. buyers should shortlist suppliers based on industry fit, project scope, ownership model, and service reach. A steel mill in the Midwest, a glass plant in Pennsylvania, and a chemical unit near Houston may end up with different best-fit suppliers even when all are evaluating on-site oxygen.
Supplier comparison on practical buying factors
The following comparison chart summarizes how project teams often score supplier categories on practical decision criteria. These are realistic directional values used for planning discussions, not formal ratings.
Detailed supplier view for U.S. buyers
| Company | Typical project approach | Industries served | Advantages | Potential limitation to check | Recommended due diligence question |
|---|---|---|---|---|---|
| Air Liquide | Large engineered industrial gas solutions | Steel, chemicals, glass, refining | Strong process integration and service infrastructure | Commercial model alignment with customer ownership preference | Can you provide customer-owned on-site oxygen references similar to our duty? |
| Linde | Integrated gas and engineering projects | Steel, petrochemicals, large manufacturing | Extensive operational expertise and proven scale | Project complexity can increase decision cycle | What redundancy strategy is recommended for our interruption cost profile? |
| Air Products | Industrial gas supply and engineered systems | Chemicals, refining, metals | Strong large-site execution and support | Need clarity on ownership, O&M, and supply boundaries | How do you define guaranteed availability and planned maintenance exclusions? |
| Atlas Copco Gas and Process | Equipment-oriented packaged solutions | Broad industrial users | Good equipment familiarity and aftermarket support | Fit for very large custom oxygen projects must be checked | Which critical components are locally stocked in the U.S.? |
| PKU Pioneer | EPC, turnkey, and customer-owned plant solutions | Steel, chemicals, glass, energy, by-product gas utilization | Deep VPSA/PSA specialization and strong cost-performance | Buyers should define U.S. field support plan early in procurement | Which commissioning, remote diagnostics, and spare-part commitments are included for U.S. sites? |
| Regional integrators | Project-specific engineering and integration | Utilities, mid-size industry, retrofit projects | Flexible local coordination and faster communication | May depend on third-party core technology | Who carries process performance responsibility after startup? |
This comparison helps procurement teams ask sharper questions. It is especially useful during early RFQ stages when impressive claims are common but practical support commitments are still vague.
Our company
For U.S. buyers evaluating industrial gas separation specialists, PKU Pioneer stands out as a technology-driven supplier focused on customer-owned EPC, turnkey, and customized plant delivery rather than BOO or bulk gas supply. The company has completed more than 400 industrial projects in over 20 countries and built total installed oxygen capacity exceeding 2 million Nm3 per hour, including very large VPSA oxygen references and projects serving more than 100 leading steel enterprises. Its product strength is supported by an integrated model that combines in-house research and development, proprietary adsorbent and catalyst manufacturing, precision engineering, complete equipment fabrication, and strict quality systems backed by ISO, CE, and ASME credentials plus more than 180 patents; that combination gives U.S. project teams traceable evidence on materials, manufacturing consistency, and process know-how rather than simple trading activity. For cooperation, PKU Pioneer can serve end users, engineering contractors, distributors, dealers, brand owners, and project developers through flexible EPC, turnkey, OEM/ODM-adjacent customization, wholesale equipment supply, pilot testing, retrofit, leasing, and regional partnership models depending on project scope. For service assurance, the company supports projects through online and offline pre-sales engineering, commissioning assistance, operation and maintenance support, system upgrades, and a documented 24-hour response commitment, while its established international project footprint shows that it works as a long-term industrial partner in overseas markets, including those requiring demanding performance and documentation standards. Buyers can review the company’s VPSA oxygen technology overview, explore global industrial reference projects, learn more about technical capabilities and support resources, or contact the team for a U.S.-focused project discussion.
How to interpret uptime claims during procurement
A surprising number of uptime claims are not directly comparable. One supplier may state mechanical availability excluding utility failures, operator errors, and scheduled maintenance. Another may quote overall availability including all causes but based on a modeled year rather than operating history. U.S. buyers should therefore standardize definitions in the RFQ. Require clear treatment of planned shutdowns, consumables replacement, and utility upsets.
It is also essential to ask what evidence supports the claim. The strongest evidence comes from operating references in similar industries, climates, and capacity ranges. Plants handling dusty ambient conditions in steel corridors or large thermal swings inland can reveal reliability truths that polished proposal slides often hide. Ask for examples where the supplier improved uptime after commissioning, because that shows practical field competence rather than only initial design ability.
Common reasons VPSA uptime underperforms
The most frequent causes of underperformance are usually straightforward. Inlet air contamination damages adsorbent performance and increases pressure drop. Poor blower maintenance creates unstable vacuum levels. Valve wear introduces timing errors and incomplete switching. Instrument drift causes false trips or concealed process deviations. In some facilities, unstable utilities or weak grounding create recurring controls issues that are incorrectly blamed on the VPSA core process.
Many of these problems can be prevented. Better filtration, moisture control, predictive maintenance, critical-spares planning, and realistic operator training often deliver more uptime value than chasing the lowest purchase price. That is why broad installation statistics consistently favor suppliers who pair process design with practical lifecycle support.
2026 outlook: technology, policy, and sustainability trends
Looking toward 2026, several trends are likely to shape how uptime statistics are interpreted in the United States. First, digital condition monitoring will become more standard. More projects will include blower vibration monitoring, valve cycle analytics, remote diagnostics, and predictive maintenance dashboards. This will not eliminate outages, but it should reduce surprise failures and improve planned intervention quality.
Second, decarbonization and industrial efficiency policy will keep pushing manufacturers toward lower-energy oxygen supply strategies where technically appropriate. As energy reporting becomes more disciplined, uptime and power consumption will be evaluated together. A plant that is available but inefficient may lose favor against one that achieves both reliability and lower specific energy use.
Third, sustainability planning will increasingly include resource utilization and by-product gas recovery. Suppliers that can combine oxygen generation expertise with broader gas separation know-how may be better positioned for integrated industrial projects. This is especially relevant in steel and chemicals, where plants are looking at process intensification, fuel substitution, and circular use of gas streams.
Finally, supply-chain resilience will remain a strategic concern. U.S. buyers will continue to favor suppliers who can document local or regional parts access, remote support readiness, and practical commissioning resources. In this environment, uptime statistics will evolve from a simple equipment metric into a broader measure of engineering quality, support organization, and operational resilience.
FAQ
What is a good uptime target for a VPSA oxygen plant in the United States?
For many industrial applications, a practical target is availability in the high 90% range, with the exact expectation depending on redundancy, site conditions, maintenance discipline, and interruption cost.
Are uptime statistics from 400+ installations enough to predict my project result?
They are useful for benchmarking, but your actual result depends on local conditions such as dust, humidity, operator capability, utility quality, and the support model written into the contract.
How should I compare uptime claims from different suppliers?
Use a common definition of availability, require similar exclusions and inclusions, ask for operating references in comparable industries, and review restart time, failure frequency, and spare-parts strategy in addition to headline percentages.
Does a customer-owned VPSA plant need liquid oxygen backup?
Not always, but many U.S. plants still keep some backup storage or contingency planning, especially where interruption costs are high or local service access could be delayed by weather or logistics.
Why do some lower-cost plants show weaker uptime later?
Common reasons include underdesigned blowers, lower-grade valves, weaker filtration, limited controls logic, and insufficient commissioning or maintenance planning. The cheapest capex can create the highest downtime cost.
Can international suppliers compete effectively in the U.S. market?
Yes, if they provide strong certifications, credible large-scale references, clear EPC or turnkey scope, documented service commitments, and a realistic plan for U.S. commissioning, spares, and after-sales support.
Where can I start if I need a project-specific review?
Begin by defining oxygen flow, purity, load profile, utility conditions, backup philosophy, and maintenance resources. Then ask shortlisted suppliers for a site-specific uptime and lifecycle cost analysis rather than a generic brochure quote.

About the Author
Founded in 1999, PKU Pioneer specializes in VPSA and PSA gas separation technologies, adsorbents, catalysts, and integrated engineering solutions. Backed by strong R&D capability and extensive industrial project experience, the company serves global customers across steel, chemical, energy, environmental protection, and related industries.
Share
Related News
-
U.S. Oxygen Plant Supply Chain Guide for 2026 Buyers
The oxygen plant supply chain in the United States is becoming more strategic in 2026 as steel, glass, chemicals, water treatment, healthcare support, and energy transition projects all compete for reliable gas infrastructure. Buyers are no longer evaluating only purchase price. They are assessing equipment lead times, domestic service coverage, power efficiency, adsorption material quality, control system reliability, spare parts availability, EPC execution, and regulatory readiness. In practical terms, a strong oxygen generation supply chain now means selecting the right process technology, qualifying suppliers with proven delivery records, structuring contracts for uptime, and building redundancy around critical components such as blowers, valves, analyzers, compressors, adsorbents, and PLC systems.If you need to secure an oxygen plant supply chain in the United States in 2026, the most practical approach is to shortlist suppliers with proven U.S. engineering support, established spare parts channels, and real operating references in industrial sectors. For large on-site oxygen generation, Air Liquide Engineering & Construction, Linde Engineering, Air Products, Matheson, and Atlas Copco Gas and Process are commonly evaluated, while modular VPSA and PSA alternatives are increasingly attractive for mid-size and fast-track projects.For buyers that want lower lifecycle cost, faster startup, and reduced dependence on delivered liquid oxygen, a VPSA or PSA plant with customer-owned EPC or turnkey delivery is often the best fit. Prioritize suppliers that can support major industrial hubs such as Houston, Pittsburgh, Gary, Detroit, Chicago, Mobile, Los Angeles, and the Gulf Coast.Qualified international suppliers can also be considered, especially when they hold relevant certifications and provide strong pre-sales and after-sales support in the U.S. market. Chinese manufacturers with real industrial references, competitive energy performance, and responsive service models may offer strong cost-performance advantages for customer-owned oxygen plant projects.The U.S. industrial gas market remains one of the most sophisticated in the world, but it is also exposed to supply chain volatility. Ports such as Los Angeles/Long Beach, Houston, Savannah, New York/New Jersey, and Norfolk continue to influence lead times for imported equipment and instrumentation. Inland manufacturing centers from Ohio and Pennsylvania to Indiana and Texas shape demand for oxygen used in steelmaking, glass furnaces, non-ferrous metallurgy, wastewater treatment, and chemical oxidation. In 2026, three forces are defining oxygen plant procurement decisions.The first is resilience. Lessons from recent disruptions have pushed buyers to reduce dependence on trucked liquid oxygen, particularly in regions where weather, driver shortages, or peak medical demand can tighten supply. The second is energy cost. Electricity pricing varies widely across states, so plant efficiency and turndown performance matter more than ever. The third is decarbonization. Industrial users are under pressure to reduce fuel intensity and optimize process chemistry, and oxygen enrichment can improve combustion efficiency, support waste-to-value projects, and reduce nitrogen load in downstream units.These trends are increasing interest in on-site systems, especially VPSA oxygen plants for medium to large demand ranges and PSA oxygen generators for smaller continuous needs. Buyers are also paying closer attention to domestically stocked spare parts, local commissioning teams, cybersecurity of control systems, and service agreements that guarantee response times.The chart above illustrates a realistic upward trend in U.S. project demand for oxygen generation systems. Growth is driven by plant modernization, reshoring of manufacturing, and a stronger preference for independent gas supply. In cities tied to steel and heavy industry, such as Pittsburgh, Cleveland, Gary, and Birmingham, oxygen plants are being evaluated not only for traditional process use but also for efficiency upgrades. In Gulf Coast locations such as Houston, Beaumont, and Baton Rouge, chemical and refining ecosystems continue to support demand for custom gas systems and integration services.An oxygen plant is not a single machine. It is a chain of engineering, manufacturing, logistics, controls, commissioning, consumables, and field support. Even a technically sound design can underperform if one link fails. Long-lead blowers, delayed valves, low-grade adsorbent, incompatible control architecture, or weak field service can all create operational risk. This is why procurement teams increasingly map the supply chain by subsystem.Key supply chain layers include process design, pressure vessel fabrication, piping skids, rotating equipment, electrical and controls integration, analyzers, adsorbents, catalysts where relevant, freight coordination, site erection, commissioning, operator training, and lifecycle maintenance. U.S. buyers are also evaluating whether a supplier can support future debottlenecking, remote diagnostics, and system retrofits instead of forcing a full plant replacement.The right oxygen supply solution depends on purity target, flow range, pressure requirements, operating profile, utility costs, and site constraints. The common options below are the ones most often compared by U.S. buyers. Common Oxygen Supply Options for U.S. Industrial Buyers Product Type Typical Oxygen Purity Typical Capacity Range Best Use Case Main Advantage Main Limitation VPSA oxygen plant 80% to 94% Medium to very large Steel, glass, non-ferrous, wastewater, combustion enrichment Low energy consumption and good large-scale economics Usually not for ultra-high purity needs PSA oxygen generator 90% to 95% Small to medium Fabrication, water treatment, compact industrial sites Simple modular deployment Less efficient at large scale than VPSA Cryogenic ASU High purity, often 99%+ Large to very large Integrated industrial gas complexes High purity and co-production flexibility Higher capital intensity and longer project timelines Liquid oxygen purchase Merchant grade Variable Backup supply, low usage sites, temporary demand Low upfront capital Exposure to delivery and price volatility Portable or skid oxygen package Variable Small Remote sites, pilot projects, emergency needs Fast deployment Limited scale Hybrid on-site plus LOX backup Project specific Small to large Plants needing redundancy Improved resilience More complex supply planning This comparison matters because many U.S. buyers over-specify purity or underestimate operating flexibility. For example, steel and glass plants often do not need cryogenic purity for all applications. A correctly designed VPSA system may deliver lower total cost and better startup flexibility, particularly where the process can benefit from rapid load changes.Demand for oxygen generation is not uniform. Heavy manufacturing corridors, chemical clusters, and water infrastructure programs shape where oxygen plants are being considered most aggressively. The chart below compares realistic relative demand from key sectors in 2026.Steel remains the strongest demand center for large oxygen plants, especially in integrated mills and EAF-adjacent processes that use oxygen enrichment. Glass is another strong segment because oxygen-enriched combustion can improve furnace performance and emissions outcomes. Water and wastewater treatment demand is growing steadily as municipalities modernize aeration and oxidation processes, particularly in large metro areas.In 2026, the best oxygen plant procurement strategy is not just about vendor comparison. It is about reducing future operational surprises. A good buying framework should cover technical, commercial, logistics, and service dimensions.Start with process definition. Clarify normal flow, peak flow, annual operating hours, oxygen purity, delivery pressure, ambient design conditions, utility quality, and required turndown. Then verify how the plant will be used during seasonal or production swings. A plant that performs well at 100% load but struggles at 40% can become a hidden cost center.Next, review component sourcing. Ask where the major blowers, vacuum pumps, oxygen analyzers, valves, instrument air package, PLC hardware, MCC equipment, and adsorbent materials are produced and stocked. If critical parts depend on a single overseas source with no U.S. inventory, downtime risk rises sharply. Buyers should also evaluate whether fabrication uses recognized standards and whether weld procedures, pressure tests, leak tests, and factory acceptance tests are documented.Finally, qualify field support. Who will commission the plant? Who trains operators? How quickly can service engineers reach a site in Indiana, Texas, California, or Alabama? Can the supplier provide remote troubleshooting, consumables planning, and process optimization after startup? These questions directly affect uptime. Buyer Checklist for a Reliable Oxygen Plant Supply Chain Evaluation Area What to Check Why It Matters Good Sign Warning Sign Buyer Action Process design Purity, flow, pressure, turndown, startup time Defines plant fit and energy use Detailed duty case and guarantees Generic quote with weak assumptions Request a full design basis Core equipment Blowers, valves, analyzers, PLC, vessels Direct effect on reliability Named brands and spare parts plan Unspecified makes Ask for component list Adsorbent quality Material source and test records Determines separation performance Traceable batches and lifecycle data No performance evidence Request test certificates Manufacturing standards ISO, CE, ASME where relevant Supports compliance and quality control Documented QA and FAT procedures Limited documentation Audit QA package Service network Commissioning and after-sales coverage Reduces downtime Rapid response commitment Remote-only support Define service SLA in contract Project execution EPC, turnkey, or supply-only scope Affects schedule and site risk Clear interface matrix Unclear owner responsibilities Align responsibilities early The table above is practical because many disputes come from scope gaps. For example, a supplier may quote the process package but exclude foundations, oxygen buffer vessels, power distribution, or analyzer shelter integration. A precise scope matrix can prevent change orders later.Oxygen plants are now used in a wider set of U.S. applications than many buyers assume. Traditional heavy industrial use remains dominant, but modern demand also comes from circular economy projects, environmental compliance, and specialty process upgrades.In steel, oxygen is used for enrichment, decarburization support, and process intensification. In glass, oxygen-enriched combustion can support furnace performance and emissions targets. In wastewater treatment, oxygen improves biological treatment and oxidation capacity where land constraints or high loading make conventional aeration less effective. In chemicals, oxygen supports oxidation reactions, partial oxidation, and process stability. In non-ferrous metals and mining-related processing, oxygen can improve throughput and recovery. In energy transition projects, oxygen can support gasification, syngas optimization, and by-product gas utilization.The market is clearly shifting away from one-size-fits-all gas supply. More operators are balancing self-generation with merchant backup, especially when they want control over uptime and operating cost. The area chart below reflects the trend shift in buyer preference over recent years.This trend does not mean liquid oxygen disappears. It means strategic users are redesigning supply models. A common 2026 strategy is to install a customer-owned VPSA or PSA unit for base load and retain LOX storage for backup, peak shaving, or maintenance intervals. This hybrid approach is especially useful in regions exposed to severe weather or transport bottlenecks.The U.S. market includes large industrial gas corporations, engineering firms, compressor-focused companies with gas system capabilities, and international suppliers pursuing customer-owned oxygen generation opportunities. The table below gives a practical supplier overview for buyers comparing options. Notable Oxygen Plant Suppliers Relevant to the United States Company Primary Service Region Core Strengths Key Offerings Typical Fit Notes for Buyers Air Liquide Engineering & Construction United States nationwide Large project engineering, industrial gas expertise Cryogenic and large gas systems Large complex industrial projects Strong for major integrated facilities Linde Engineering United States and global High-end process engineering, large ASU experience Cryogenic air separation and process integration High-purity and large-scale requirements Best for sophisticated integrated plants Air Products United States nationwide Gas supply infrastructure and engineering depth Industrial gas systems and on-site supply solutions Large industrial users Often evaluated by major process industries Matheson United States nationwide Broad industrial gas footprint, packaged solutions Gas supply systems and service support Mixed industrial applications Useful where service breadth matters Atlas Copco Gas and Process North America Compression and gas generation package expertise PSA systems, compressors, integration packages Medium-scale modular projects Good for compact and skid-based systems PKU Pioneer United States projects and global industrial markets Large VPSA technology, adsorbent development, turnkey delivery VPSA oxygen plants, PSA oxygen generators, EPC/turnkey customer-owned plants Cost-sensitive industrial buyers seeking efficient on-site generation Strong fit for steel, glass, chemical, and energy-related projects This table should be read as a starting point, not a final ranking. A suitable supplier depends on purity target, flow rate, schedule, ownership model, and the owner’s in-house engineering capacity. Some suppliers are strongest in large cryogenic systems, while others are more competitive in modular or large VPSA projects.For many U.S. buyers, the actual question is not which brand is biggest, but which supply model best matches the plant’s technical and commercial reality. The chart below compares representative strengths by project profile.The comparison highlights why VPSA is gaining traction. It combines relatively strong energy efficiency with useful turndown capability and shorter deployment than many large cryogenic alternatives. For U.S. manufacturers under schedule pressure, that combination is increasingly attractive.Air Liquide Engineering & Construction and Linde Engineering remain highly credible for large, technically demanding projects, especially where high purity, full plant integration, and extensive owner engineering interfaces are involved. Air Products similarly remains important in sectors with long-term gas infrastructure needs. Matheson can be attractive for buyers who value broad gas service coverage and practical integration support. Atlas Copco is often considered when modularity, package simplicity, and compressor-related competence are central to the project.For customers pursuing customer-owned on-site oxygen generation rather than merchant dependence, industrial oxygen generation solutions from specialist VPSA suppliers deserve close attention. In particular, VPSA oxygen plant technology is increasingly relevant for U.S. steel, glass, chemical, and environmental projects that need lower energy use, rapid startup, and scalable capacity. Buyers that want proof of delivery should review documented global oxygen and gas utilization projects before making a final shortlist.PKU Pioneer serves the U.S. market as a specialist in customer-owned EPC, turnkey, and owner-operated oxygen plant solutions rather than BOO or on-site bulk supply services. Its strength is grounded in an integrated manufacturing model that combines in-house research and development, proprietary adsorbent and catalyst production, precision engineering, complete equipment fabrication, and commissioning support, backed by more than 180 patents and internationally recognized certifications including ISO, CE, and ASME-related manufacturing capabilities where applicable. For oxygen generation, the company’s VPSA and PSA systems are supported by self-developed adsorbents such as the PU-8 molecular sieve, strict process control, and documented industrial performance, including over 400 completed projects in more than 20 countries and installed oxygen capacity above 2 million Nm3 per hour, with landmark large-scale VPSA references in steel. This depth allows flexible cooperation models for U.S. end users, engineering contractors, distributors, dealers, brand owners, and project developers through OEM, ODM, wholesale, direct project supply, and regional partnership structures, while keeping system ownership in customer hands. For local assurance, the company supports buyers through fast proposal response, online technical consultation, commissioning assistance, operator training, retrofit and upgrade services, spare parts planning, equipment leasing options, and long-term operation and maintenance support; its established export track record, multilingual commercial engagement, and ongoing service infrastructure demonstrate a sustained market commitment rather than a remote one-off export model. U.S. buyers seeking practical project dialogue can use the company’s technical support resources or contact the project team for tailored oxygen plant discussions.Industrial buyers tend to trust references with measurable results, and that is the right instinct. Large oxygen projects are won or lost in execution and operating stability, not in brochure language. One useful lesson from large VPSA deployments is that scale does not have to mean slow response. High-capacity systems can still offer fast startup and flexible load adjustment when the process architecture, blower selection, control logic, and adsorbent performance are properly matched.Another practical lesson comes from by-product gas utilization and steel-chemical integration projects. Facilities that already operate in gas-rich environments often discover that oxygen supply decisions affect wider plant economics, including furnace efficiency, fuel substitution, and downstream chemical opportunities. This is especially relevant in U.S. heavy industry clusters where management teams are trying to lower total energy intensity rather than optimize a single unit in isolation.When reviewing case studies, buyers should look beyond capacity numbers and ask five practical questions. Was the plant commissioned on schedule? What was the actual power consumption range in operation? How stable was oxygen purity during load changes? How quickly did the supplier respond after handover? And were there measurable cost savings versus prior gas supply arrangements? Those questions separate real operating value from marketing claims.If you are planning an oxygen plant in the United States, the best procurement path depends on project scale and risk tolerance. For large and complex integrated projects with high purity requirements, a cryogenic route may still be justified. For medium to large applications focused on economics, flexibility, and speed, VPSA deserves serious evaluation. For smaller distributed sites, PSA often provides the cleanest business case.Buyers should request a guaranteed performance package covering purity, flow, specific power consumption, startup time, and turndown range. They should also request a complete list of exclusions, commissioning deliverables, and owner responsibilities. Where possible, build in a spare parts package for the first two years, remote monitoring capability, and at least one on-site training cycle after startup.Commercially, many U.S. owners are moving toward milestone-based contracts tied to engineering approval, factory acceptance, shipment, mechanical completion, and performance acceptance. This is a sensible way to control execution risk. Projects near major logistics gateways such as Houston, New Orleans, Baltimore, Charleston, and Los Angeles should also review inland transport limitations early, especially for oversized skids or vessels. Common Risks in the Oxygen Plant Supply Chain and How to Reduce Them Risk Typical Cause Impact Early Warning Mitigation Best Contract Measure Long lead components Late ordering of blowers or controls Schedule delay Unconfirmed procurement status Freeze vendor list early Milestone tracking with vendor visibility Energy underperformance Weak process matching or poor adsorbent Higher operating cost Vague power guarantee Demand guaranteed kWh performance Performance acceptance clause Purity instability Control tuning or valve issues Production interruption Insufficient FAT testing Expanded FAT and SAT scope Defined purity acceptance window Spare parts shortage No local stock planning Extended downtime Supplier cannot quote lead times Buy critical spares upfront Spare parts annex in contract Scope gap Unclear EPC interfaces Cost overrun Ambiguous battery limits Use interface responsibility matrix Detailed exclusions and inclusions Weak after-sales response No field support plan Slow problem resolution No named service contact Set response SLA and escalation path Service terms in main agreement The value of this table is practical. It turns procurement into risk management. Most oxygen plant failures in commercial terms do not come from impossible technology; they come from weak planning, poor documentation, and inadequate service preparation.Three future trends deserve close attention. The first is digitalization. More buyers will require remote diagnostics, predictive maintenance, and data access through secure industrial control environments. The second is sustainability. Oxygen plants that can demonstrate lower specific power consumption, improved process efficiency, and support for fuel substitution will have an advantage in corporate capital approval processes. The third is policy alignment. Federal and state incentives tied to industrial efficiency, emissions reduction, and domestic manufacturing resilience may influence project timing and technology choice.There is also a growing trend toward modularization. Fabricating more of the plant off-site reduces field labor risk and can improve quality consistency. At the same time, owners are increasingly willing to consider global specialist suppliers when they can document performance, certifications, and local support coverage. That makes the competitive landscape broader in 2026 than it was a few years ago.For most industrial users, the most secure strategy is a customer-owned on-site oxygen plant sized for base load, combined with backup liquid oxygen storage or a contingency supply plan. This reduces dependence on external deliveries while maintaining resilience during maintenance or unexpected production surges.It depends on purity and scale. If you need very high purity and integrated multi-gas production, cryogenic may be the right choice. If your application can use 80% to 94% oxygen and you want lower energy use, faster startup, and strong economics at medium to large scale, VPSA is often the stronger option.Review process guarantees, power consumption, startup time, turndown range, component brands, adsorbent source, control system architecture, spare parts list, commissioning scope, operator training, warranty, and after-sales response terms. Also verify all exclusions.It is critical. Even a strong plant design can become a liability if the supplier cannot support startup issues, controls tuning, or spare parts needs quickly. U.S. buyers should require defined response times and named service contacts.Yes. International suppliers can be competitive when they provide relevant certifications, documented industrial references, transparent quality control, practical U.S.-focused engineering communication, and credible pre-sales and after-sales support. They are especially attractive when cost-performance matters and the project is customer-owned.No. The company focuses on EPC, turnkey, and customer-owned oxygen plant solutions, including VPSA and PSA systems, along with retrofit, upgrade, technical support, and related engineering services.Securing an oxygen plant supply chain in the United States in 2026 means treating oxygen generation as a long-term infrastructure decision, not just an equipment purchase. The strongest buyers will define process needs clearly, compare technology options honestly, qualify suppliers by real execution capacity, and contract for lifecycle support rather than just delivery. In a market shaped by resilience, energy cost, and sustainability, well-structured on-site oxygen generation is becoming a practical strategic asset for U.S. industry. -
Deoxidants in Gas Purification for the Global Market
A deoxidant is a material, usually a catalyst or reactive purification medium, used to remove trace oxygen from industrial gases. In gas purification, it converts oxygen into another compound, most often water or carbon dioxide, through controlled chemical reactions on a catalyst surface. For example, oxygen in hydrogen can be removed through the reaction H2 + 1/2O2 → H2O, followed by drying. Oxygen in carbon monoxide-rich gas can be removed through CO + 1/2O2 → CO2, followed by CO2 removal when required.In the Global Market, deoxidants are used in hydrogen purification, nitrogen treatment, synthesis gas conditioning, natural gas processing, electronics gases, heat treatment atmospheres, petrochemical plants, steel mills, chemical parks, and laboratories. Typical buyers compare catalyst type, oxygen removal depth, operating temperature, pressure drop, regeneration requirements, sulfur resistance, safety design, and total cost of ownership.The simplest way to understand a deoxidant is this: an adsorbent captures impurities physically or selectively, while a deoxidant chemically removes oxygen by converting it. In many industrial purification systems, both are used together. A deoxidation bed may first convert oxygen, while downstream molecular sieves, activated alumina, or carbon adsorbents remove the reaction products and residual moisture.QuestionPractical AnswerIndustrial MeaningWhat does a deoxidant remove?Trace oxygen from gas streams.Protects catalysts, products, pipelines, and downstream processes.Is it the same as an adsorbent?No. A deoxidant reacts chemically; an adsorbent captures molecules.Selection must match the impurity and process objective.What gases are commonly treated?Hydrogen, nitrogen, carbon monoxide, natural gas, syngas, and inert gases.Used across chemical, energy, metallurgical, and electronics industries.What are typical active metals?Copper, nickel, palladium, manganese, and mixed oxides.Different metals fit different temperature and gas compositions.What is produced after deoxidation?Water or carbon dioxide, depending on the reducing gas.Dryers or adsorbers are often installed after the catalyst bed.What purity can be achieved?From ppm oxygen levels down to sub-ppm in properly designed systems.Supports high-purity and ultra-high-purity gas specifications.This table shows why deoxidant selection should not be treated as a generic purchase. The correct product depends on feed gas composition, oxygen concentration, final purity requirement, operating safety envelope, and integration with upstream PSA, VPSA, compression, drying, or polishing units.A deoxidant in industrial gas purification is a functional medium designed to reduce the oxygen content of a gas stream. It may work as a sacrificial material that is gradually consumed, a regenerable catalyst that alternates between oxidation and reduction states, or a noble-metal catalyst that promotes a continuous reaction between oxygen and a reducing component already present in the gas. The role is to prevent oxygen from interfering with downstream processes, lowering product purity, causing oxidation damage, forming explosive mixtures, or poisoning sensitive catalysts.In modern gas plants, oxygen control is increasingly important because process margins are tighter and product specifications are more demanding. Hydrogen used in fuel cells, ammonia synthesis, hydroprocessing, and electronic materials requires strict control of oxygen and moisture. Nitrogen used in heat treatment, food packaging, lithium battery production, and chemical blanketing often needs low residual oxygen. Carbon monoxide used for chemicals such as acetic acid, formic acid, phosgene intermediates, and monoethylene glycol routes must be protected from oxidation and composition drift.Global industrial clusters such as Houston, Rotterdam, Antwerp, Singapore, Shanghai, Mumbai, Jubail, Yokohama, Ulsan, Hamburg, São Paulo, and the United Arab Emirates’ industrial zones all rely on stable gas quality. Ports and trade hubs including Port of Rotterdam, Port of Singapore, Ningbo-Zhoushan, Jebel Ali, Busan, Los Angeles, and Santos support the movement of catalysts, pressure vessels, modular skids, compressors, valves, and analyzers used in deoxygenation projects.Industrial gas purification rarely consists of a single unit operation. A deoxidant bed may be placed after compression, before a dryer, after a PSA purification stage, or within a polishing train. The arrangement depends on the chemistry. In hydrogen service, oxygen reacts with hydrogen to form water; therefore, a downstream dryer is required. In carbon monoxide service, oxygen reacts with CO to form carbon dioxide; therefore, a CO2 removal step may be needed if the product specification is strict. In nitrogen service, a small amount of hydrogen may be added before a palladium or nickel catalyst to remove oxygen, followed by moisture removal.When evaluating a deoxidation system, plant owners should review feed variation, startup and shutdown conditions, oxygen spikes, moisture load, sulfur or chloride contamination, bed temperature rise, catalyst life, and maintenance access. A safe design includes oxygen monitoring, temperature monitoring, pressure relief, emergency isolation, inert purging, and clear operating procedures.The main industrial deoxidant families include copper-based, nickel-based, palladium-based, and manganese-based products. Each group has a specific performance window. No single deoxidant is best for every gas. The right choice depends on whether the stream contains hydrogen, carbon monoxide, hydrocarbons, nitrogen, argon, sulfur compounds, moisture, or other reactive components.Copper-based deoxidants are widely used because copper oxide and metallic copper can participate in oxygen removal and regeneration reactions. They are often applied in inert gas purification, hydrogen purification, and low-temperature polishing duties. Copper materials can be sensitive to sulfur and must be protected from contaminants. Their benefit is stable performance and relatively economical cost.Nickel-based deoxidants are valued for robust catalytic activity in hydrogen-containing streams and certain hydrocarbon or synthesis gas environments. Nickel catalysts may require activation and careful temperature control. They can be vulnerable to sulfur poisoning, carbon deposition, or chloride contamination, but they are effective when process conditions are properly managed.Palladium-based deoxidants are frequently selected for high-purity nitrogen, argon, hydrogen, and specialty gas applications. Palladium has excellent activity for hydrogen-oxygen recombination, allowing deep oxygen removal at relatively low temperatures when hydrogen is available. The main limitation is higher cost. For ultra-high-purity gases, however, the performance benefit can justify the investment.Manganese-based deoxidants, including manganese oxide materials, are used where oxygen storage and redox properties are useful. They may function in lower-cost purification duties, oxygen scavenging, and certain regenerable beds. Their performance depends strongly on formulation, support, particle strength, temperature, and regeneration method.Deoxidant TypeTypical UseStrengthLimitationCommon Follow-Up StepCopper-basedHydrogen, nitrogen, inert gas polishingCost-effective and stableSensitive to sulfur and some poisonsDrying or regenerationNickel-basedHydrogen-rich gas, syngas, hydrocarbon processingStrong catalytic activityNeeds careful activation and poison controlMoisture or CO2 removalPalladium-basedHigh-purity nitrogen, argon, hydrogen, specialty gasesVery deep oxygen removalHigher material costHigh-efficiency dryerManganese-basedOxygen scavenging and redox purificationGood oxygen storage behaviorFormulation-dependent performanceRegeneration or replacementMixed oxideIndustrial polishing unitsBalanced cost and activityRequires pilot validationAdsorbent polishingNoble-metal promotedUltra-low oxygen applicationsFast reaction at low concentrationRequires clean feed gasMoisture and trace impurity removalThe table highlights a key procurement principle: buyers should not compare only price per kilogram. They should compare oxygen capacity, activity, pressure drop, temperature window, expected lifetime, regeneration method, and the cost of downtime. In large plants, a catalyst that lasts longer and protects production quality often has a lower total cost even if its initial price is higher.Catalytic deoxidation removes oxygen through surface reactions. Gas molecules diffuse through the bed, reach the catalyst surface, adsorb temporarily, react with another component, and desorb as a new product. The catalyst provides active sites that lower the activation energy of the reaction. It is not simply a filter. It changes the chemical state of oxygen.In hydrogen-containing gas, oxygen molecules adsorb on the active metal surface and react with dissociated hydrogen atoms. The product is water vapor. Because even a small amount of water may violate product specifications, a dryer is commonly placed downstream. Activated alumina, molecular sieve, silica gel, or specialized adsorbents may be selected depending on dew point target.In carbon monoxide-containing gas, oxygen reacts with CO to form CO2. This is useful in CO purification but requires attention because the reaction is exothermic and because excessive CO2 may need to be removed by PSA, chemical absorption, or adsorbent polishing. In natural gas processing, oxygen removal must be designed carefully because uncontrolled oxidation of hydrocarbons is not desired.The mechanism also depends on mass transfer. If gas velocity is too high, oxygen may break through before reaching active sites. If particles are too small, pressure drop can become excessive. If temperature is too low, reaction rate may decline. If the catalyst is poisoned by sulfur, chloride, heavy hydrocarbons, or oil aerosols, active sites may be blocked. Good system design balances reaction kinetics, heat management, mechanical strength, and operating flexibility.For safety, deoxidation beds handling hydrogen, CO, or hydrocarbons must be engineered with strict attention to flammability and exotherm control. Oxygen concentration limits, purge sequences, temperature alarms, and automatic shutdown logic are not optional extras; they are core parts of reliable plant design.The most common deoxidation reactions in industrial gas purification are hydrogen-oxygen recombination and carbon monoxide oxidation. In simplified form, these are often written as H2 + O2 → H2O and CO + O2 → CO2. In balanced chemical equations, they are 2H2 + O2 → 2H2O and 2CO + O2 → 2CO2. Industrial discussions often use simplified expressions to emphasize the conversion pathway.In a hydrogen purification unit, oxygen removal is typically followed by water removal. The deoxidation catalyst converts oxygen to water, and the dryer reduces dew point to the required level. If the hydrogen is used for fuel cells, electronics, or advanced metallurgy, downstream polishing may also remove CO, CO2, hydrocarbons, ammonia, or sulfur compounds.In CO-rich gas purification, the conversion of oxygen to CO2 protects the CO product and improves safety. The CO2 generated can be removed by PSA or other separation technologies. For chemical synthesis, even small changes in CO purity may affect catalyst life and reaction selectivity, so online analysis is recommended.Reaction heat is an important design factor. Oxygen removal reactions are exothermic. If feed oxygen concentration is high or if an upset occurs, the bed temperature can rise quickly. Engineers must calculate adiabatic temperature rise, select proper catalyst volume, define maximum allowable oxygen, and install thermocouples at multiple bed levels.Reaction PathwayTypical Feed GasMain Product FormedDownstream NeedKey Design ConcernHydrogen plus oxygenHydrogen, nitrogen with added hydrogen, argon with added hydrogenWater vaporDrying to low dew pointTemperature rise and moisture loadCarbon monoxide plus oxygenCO-rich gas, syngas, converter gasCarbon dioxideCO2 removal if product purity requiresExotherm and CO safetyMetal oxidationInert gas or oxygen-contaminated streamMetal oxide phaseRegeneration or replacementOxygen capacity and cycle planningHydrocarbon-assisted oxygen removalNatural gas or light hydrocarbon streamsWater and carbon oxidesProcess-specific polishingAvoiding unwanted combustionMixed redox mechanismIndustrial off-gasDepends on reducing componentsIntegrated purification trainFeed fluctuation managementTrace oxygen polishingHigh-purity product gasWater or CO2 at trace levelFinal adsorbent bedAnalyzer accuracy and breakthrough controlThe reaction table shows that deoxidation is never isolated from the rest of the plant. Every oxygen removal reaction creates a product that must be accepted, removed, or controlled. A complete design therefore includes the deoxidant, vessel, heat management, analyzers, dryers, adsorbents, valves, and operating logic.Hydrogen purification is one of the most important applications for deoxidants. Hydrogen from reforming, chlor-alkali plants, coke oven gas, methanol cracking, refinery off-gas, or water electrolysis may contain trace oxygen depending on the production and handling route. Oxygen must be removed before hydrogen is compressed, stored, used in catalysts, or supplied to high-purity users. In a PSA hydrogen system, deoxidation can be used as a polishing stage when the final specification requires extremely low oxygen.Nitrogen treatment often uses a small hydrogen addition combined with a palladium, nickel, or other deoxo catalyst. Oxygen is converted into water and then removed by drying. This configuration is common in heat treatment furnaces, powder metallurgy, electronics packaging, lithium battery materials, chemical storage, and food-grade nitrogen systems. For users near automotive hubs such as Detroit, Stuttgart, Nagoya, Pune, and Guangzhou, nitrogen quality can directly affect surface oxidation and product consistency.Natural gas processing requires careful oxygen control because oxygen may accelerate corrosion, create safety risks, or violate pipeline specifications. Oxygen can enter through air ingress, biogas upgrading, landfill gas recovery, nitrogen rejection systems, or storage operations. Deoxidation methods in natural gas must be selected according to methane content, CO2, sulfur, moisture, and pipeline standards. The design must avoid uncontrolled oxidation and must be compatible with dehydration and acid gas removal units.Carbon monoxide purification is another important area. CO is used in chemicals, metallurgy, and synthesis routes. Industrial off-gases such as blast furnace gas, converter gas, calcium carbide furnace gas, and chemical tail gas may contain valuable CO. PSA and catalyst technologies can recover and purify CO, while deoxidation helps stabilize product quality and protect downstream synthesis catalysts.In steel and metallurgical operations, controlled atmospheres are essential for annealing, reduction, sintering, and oxygen-enriched processes. In chemical parks, purified hydrogen and CO improve feedstock utilization. In electronics, ultra-low oxygen protects sensitive materials. In marine and port-based LNG or gas facilities, oxygen control supports safety and pipeline compliance.The line chart illustrates a realistic growth pattern driven by hydrogen projects, industrial gas quality upgrades, electronics expansion, low-carbon chemical production, and stricter oxygen specifications in pipeline and process gases. Demand is not limited to one region; it is connected to global investment in cleaner production and higher-value utilization of industrial by-product gases.The bar chart shows that hydrogen purification and nitrogen treatment lead demand, while CO purification and natural gas processing are also significant. Electronics gases represent a smaller volume but often require higher-value deoxidants because purity targets can be extremely strict.The difference between a deoxidant and an adsorbent is fundamental. A deoxidant removes oxygen by chemical reaction. An adsorbent removes impurities by physical adsorption, selective pore diffusion, polarity, molecular size, or surface affinity. In a gas purification plant, both may be essential, but they should not be confused.For example, a molecular sieve can adsorb water, CO2, and certain hydrocarbons. It does not necessarily convert oxygen into water or carbon dioxide. A palladium deoxidation catalyst can promote oxygen reaction with hydrogen, but it does not replace a dryer. A copper-based oxygen scavenger may remove oxygen through redox chemistry, but once its capacity is consumed it must be regenerated or replaced.In PSA and VPSA systems, adsorbents separate gases by selective adsorption under pressure or vacuum. This is different from catalytic deoxidation. However, the technologies are often combined. A PSA hydrogen unit may recover hydrogen from mixed gas, then a deoxidation and drying stage may polish it. A PSA CO system may recover carbon monoxide from industrial by-product gas, then use catalytic treatment and adsorbent polishing to meet product specifications.Buying advice should begin with a process audit. The buyer should define feed gas composition, flow rate, pressure, temperature, oxygen inlet concentration, outlet oxygen target, allowed by-products, contaminants, cycle mode, and operating philosophy. A laboratory or pilot test is valuable when the feed gas contains complex by-products such as tar, sulfur, ammonia, chlorides, heavy hydrocarbons, or fine particulates.Comparison ItemDeoxidantAdsorbentBuyer’s Practical CheckMain functionChemically removes oxygenPhysically or selectively captures impuritiesConfirm whether oxygen must be reacted or adsorbed species removedTypical productWater, CO2, or oxidized mediumLoaded adsorbent phasePlan downstream treatment or regenerationCommon materialsCu, Ni, Pd, Mn, mixed oxidesMolecular sieve, activated carbon, alumina, silica gelMatch material to impurity profileRegenerationMay require reduction or replacementPressure swing, temperature swing, purge, or replacementCalculate utilities and downtimeSystem riskExothermic reaction and catalyst poisoningBreakthrough and capacity lossInstall analyzers and protection bedsTypical use togetherDeoxo bed before dryerDryer or polishing bed after deoxoDesign the entire purification trainThis comparison helps procurement teams avoid a common mistake: purchasing only a material without confirming the system design. A deoxidant needs correct vessel sizing, distribution, temperature control, and startup procedure. An adsorbent needs correct cycle design and regeneration. A reliable plant combines materials science with process engineering.Purity requirements vary by industry and country, but the global trend is clear: oxygen limits are becoming tighter, online analysis is becoming more common, and documentation expectations are rising. Hydrogen for industrial furnaces may tolerate different oxygen levels than hydrogen for electronics or fuel cells. Nitrogen for blanketing may require low oxygen, while nitrogen for semiconductor or battery processes may require ultra-low oxygen and moisture. Natural gas pipeline standards vary by region and operator, but oxygen is usually controlled to protect corrosion management and combustion behavior.In Europe, industrial gas projects near Rotterdam, Antwerp, Hamburg, and Marseille often emphasize documentation, safety compliance, and emissions reduction. In North America, projects around Houston, Louisiana, Alberta, and the U.S. Gulf Coast often focus on refinery integration, hydrogen networks, and petrochemical reliability. In Asia, industrial hubs such as Shanghai, Ningbo, Singapore, Ulsan, Osaka, Chennai, and Jakarta demand cost-effective high-capacity systems. In the Middle East, Jubail, Yanbu, Ruwais, and Mesaieed emphasize large-scale petrochemical and gas processing reliability.Common documents include material safety data, catalyst specifications, expected lifetime, operating manuals, regeneration procedures, pressure vessel certificates, analyzer calibration plans, and performance test protocols. For international projects, ISO quality systems, CE-related compliance for applicable equipment, ASME pressure vessel requirements, and local safety codes may affect project execution.ApplicationTypical Oxygen TargetImportant Co-SpecificationCommon Technology CombinationMarket DriverIndustrial hydrogenLow ppm to sub-ppmMoisture, CO, CO2PSA, deoxo catalyst, dryerRefining, chemicals, clean energyFuel cell hydrogenVery low oxygenCO, sulfur, ammonia, waterAdvanced purification and polishingMobility and distributed energyHigh-purity nitrogenppm or lowerDew point and hydrocarbonsHydrogen addition, deoxo, dryerElectronics and heat treatmentNatural gas pipelineOperator-specific low limitWater, CO2, H2SDeoxygenation plus dehydrationBiogas, LNG, pipeline integrityCarbon monoxide productVery low oxygenCO2, N2, H2PSA CO recovery and catalytic polishingChemical synthesisElectronics gasesUltra-low oxygenMoisture and particlesNoble catalyst, getter, purifierSemiconductor and battery materialsThe table provides a practical benchmark but should not replace project-specific engineering. Final purity depends on feed gas stability, equipment leakage, valve quality, instrumentation accuracy, and operating discipline. For high-purity projects, leak testing and oxygen analyzer selection can be as important as catalyst selection.This area chart reflects a major 2026 trend: more users are moving from basic oxygen reduction to precision oxygen control. The shift is driven by high-purity hydrogen, battery materials, semiconductor expansion, green chemical routes, stricter pipeline rules, and sustainability programs that convert waste gases into valuable feedstocks.PKU Pioneer, formally Beijing Peking University Pioneer Technology Corporation Ltd., is a high-tech enterprise with deep roots in Peking University’s College of Chemistry and Molecular Engineering. Since its founding in 1999, the company has focused on VPSA and PSA gas separation, industrial gas recovery, adsorbents, catalysts, engineering design, equipment manufacturing, and turnkey project delivery. For global customers, the company provides EPC/Turnkey and customer-owned plant solutions. It does not position these offerings as BOO or on-site bulk supply services.In technological capabilities, PKU Pioneer combines process simulation, adsorbent and catalyst development, pilot testing, PSA/VPSA cycle optimization, and industrial scale-up. The company’s solutions cover VPSA oxygen generation, PSA oxygen generation, PSA carbon monoxide recovery, PSA hydrogen purification, and high-performance materials. Its self-developed adsorbents and catalysts support practical projects in steel, chemicals, glass, nonferrous metals, energy, and environmental utilization of by-product gases. Readers can learn more through the PKU Pioneer global gas separation platform.In manufacturing capabilities, the company integrates proprietary material production, equipment fabrication, skid assembly, quality control, and complete plant delivery. This integrated model helps customers reduce interface risk because adsorbent or catalyst selection, vessel design, process control, and commissioning are coordinated under one engineering framework. The company has delivered more than 400 industrial projects in over 20 countries, with total installed oxygen capacity exceeding 2 million Nm3/h. Its experience includes large VPSA oxygen systems, PSA CO recovery units, hydrogen purification systems, and modular pilot plants. More background is available at the company overview page.In service capabilities, PKU Pioneer provides consultation, custom technical proposals, engineering design, installation guidance, commissioning, operator training, system retrofit, upgrades, maintenance support, and pilot-scale validation. The service model is built around EPC/Turnkey and customer-owned plant solutions, allowing industrial users to own and operate their gas generation or purification assets rather than relying on BOO or on-site bulk supply arrangements. This is especially valuable for steel mills, chemical producers, and glass manufacturers that want cost control, fast startup, flexible load operation, and long-term process independence.Industrial case experience is central to practical gas purification. PKU Pioneer has implemented projects for blast furnace gas high-value utilization, converter gas conversion, calcium carbide furnace exhaust recovery, large-scale VPSA oxygen supply, and overseas oxygen generation. For example, by-product gas projects can recover carbon monoxide and transform low-value streams into chemical feedstock or fuel, reducing purchased energy and emissions. Project examples can be explored through world-class innovative gas separation projects.For oxygen supply applications, VPSA systems can serve large industrial users requiring stable oxygen at 80% to 94% purity, with flexible load adjustment and comparatively low energy consumption. Such oxygen systems are relevant to steel enrichment, nonferrous metallurgy, glass furnaces, wastewater treatment, pulp and paper, and chemical oxidation. Additional technical information is available at VPSA gas separation technology and VPSA oxygen generation solutions. For smaller and medium-capacity oxygen needs, PSA oxygen generator solutions may be suitable.For the deoxidant market, PKU Pioneer’s value lies not only in materials but also in system integration. A deoxidant may need to operate with PSA hydrogen purification, PSA CO recovery, dryers, analyzers, and safety interlocks. The company’s background in adsorption and catalytic purification allows engineers to evaluate the complete gas pathway rather than treating the catalyst bed as a stand-alone product.The comparison chart shows why many industrial buyers prefer an integrated supplier when deoxidation is part of a larger purification plant. Material-only suppliers may offer strong catalyst products, but integrated providers can coordinate catalyst, adsorbent, vessel, automation, commissioning, and performance guarantees.The main purpose is to remove oxygen from a gas stream by chemical reaction. This protects product purity, downstream catalysts, pipelines, furnaces, and sensitive industrial processes.Usually no. In hydrogen deoxidation, the deoxidant creates water by reacting oxygen with hydrogen. A downstream dryer or adsorbent bed is normally required to remove the moisture.Palladium-based catalysts are commonly used for high-purity nitrogen when a small amount of hydrogen is added. Nickel or other catalysts may also be used depending on cost, temperature, and purity requirements.Oxygen reacts with hydrogen on a catalyst surface to form water. The simplified reaction is H2 + O2 → H2O. In balanced form, 2H2 + O2 → 2H2O.Oxygen reacts with carbon monoxide to form carbon dioxide. The simplified reaction is CO + O2 → CO2. The generated CO2 may need to be removed if high-purity CO is required.It is safe when properly engineered. Because oxygen removal reactions can be exothermic and may involve hydrogen, CO, or hydrocarbons, the system must include oxygen limits, temperature monitoring, purge procedures, relief protection, and automatic shutdown logic.Buyers should provide gas composition, flow rate, pressure, temperature, oxygen inlet level, outlet oxygen target, moisture level, contaminants, operation hours, utilities, required certifications, and whether the system is new or a retrofit.Some can be regenerated, while others are replaced after their effective capacity or activity declines. The regeneration method depends on the active material, gas service, and contamination level.Key trends include green hydrogen growth, stricter gas purity standards, increased use of industrial by-product gases, digital analyzers, lower-carbon chemical production, modular purification skids, and stronger safety and sustainability policies.PKU Pioneer provides EPC/Turnkey and customer-owned plant solutions for gas separation and purification projects. These solutions are not BOO or on-site bulk supply services. -
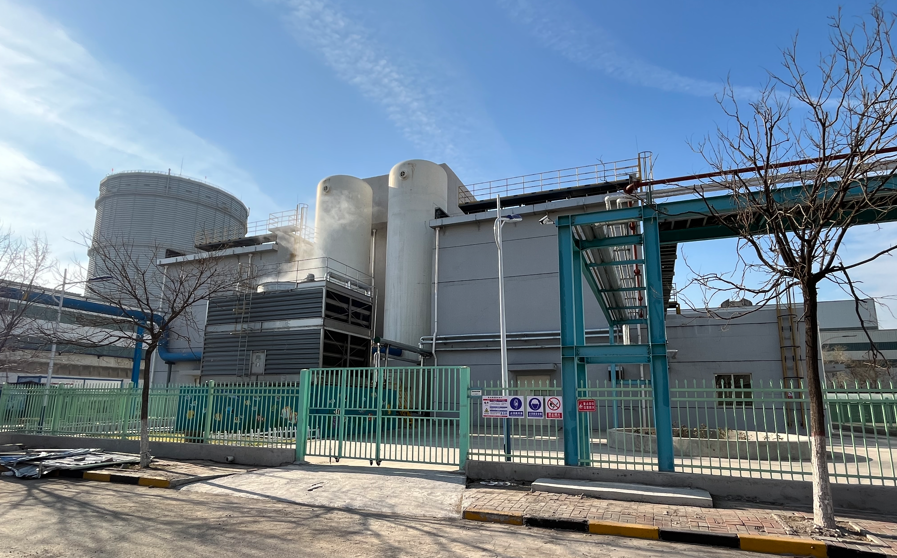
Global Market Oxygen Supply Strategies for Industry
For large industrial operations in the Global Market, the best oxygen supply model depends on consumption volume, purity requirement, site pressure, energy price, logistics risk, operating pattern and capital strategy. Bulk liquid oxygen is often suitable for medium to high purity demand where delivery infrastructure is reliable. Pipeline oxygen is effective inside industrial clusters, steel parks, petrochemical hubs and port-based manufacturing zones. Cylinders are mainly for low-volume, mobile, backup or maintenance uses. On-site VPSA and PSA oxygen generation is often the most cost-effective and resilient choice for continuous large-scale users that can accept typical oxygen purity between about 80% and 94% for VPSA, or higher customized ranges through integrated solutions.In steel, glass, paper, non-ferrous metallurgy, wastewater treatment and chemical processing, on-site generation can reduce exposure to liquid oxygen transport disruptions, vaporization losses, price escalation and supplier allocation. A buyer should evaluate oxygen in terms of delivered cost per Nm3, installed redundancy, energy use, turndown flexibility, operating maintenance support, safety compliance and long-term availability. For many continuous consumers, an EPC or turnkey customer-owned oxygen plant provides stronger lifetime economics than repeated liquid oxygen procurement, especially when demand is stable and electricity is available at competitive rates.Companies comparing global oxygen suppliers should request a full technical and commercial proposal, not just a unit price. The proposal should define purity, dew point, flow range, discharge pressure, oxygen buffer volume, backup liquid or cylinder system, remote monitoring, adsorbent life, power consumption, civil work boundary, installation time and warranty responsibility. The most robust solution is usually a hybrid plan: on-site VPSA/PSA for base-load oxygen, liquid oxygen or cylinders for emergency backup, and a control philosophy that protects the plant during maintenance, grid interruptions or seasonal demand peaks.Industrial oxygen is supplied through four main channels: bulk liquid oxygen delivery, pipeline networks, compressed gas cylinders or bundles, and on-site oxygen generation. Each method has a different balance of purity, reliability, capital cost, operating cost and operational control. In port economies such as Rotterdam, Houston, Singapore, Shanghai, Jebel Ali and Antwerp, liquid oxygen and pipeline supply can be strong because cryogenic plants, terminals and heavy industry are concentrated. In inland steel cities, mining regions, glass production belts and paper mills far from liquefaction centers, on-site VPSA or PSA generation often becomes more attractive.Bulk liquid oxygen is produced in a cryogenic air separation unit, transported by tanker and stored in insulated tanks at the user site. It offers high purity, usually above 99.5%, and can support processes that require very high oxygen concentration. However, the buyer depends on tanker scheduling, road conditions, port congestion, fuel prices, driver availability and supplier allocation during peak demand. The delivered price includes production, liquefaction, storage, transport, vaporization, tank rental and margin.Pipeline oxygen is commonly used in integrated industrial zones where one large air separation plant supplies multiple users. It reduces truck traffic and can deliver large flows, but it depends on regional infrastructure and long-term contracts. It may not be available outside established clusters.Cylinders, pallets and tube trailers are flexible but expensive per unit of oxygen. They are useful for laboratory, cutting, welding, startup, commissioning, repair and emergency functions. They are rarely the primary solution for continuous large industrial use.On-site VPSA and PSA oxygen plants separate oxygen from air at the user location. VPSA is widely used for large flows and moderate purity oxygen, especially steel, glass, non-ferrous smelting, pulp bleaching, chemical oxidation and environmental applications. PSA oxygen generators are compact and suitable for smaller or medium demand. These systems reduce logistics dependence and allow customers to own the production asset through EPC or turnkey delivery.Supply TypeTypical PurityBest FitAdvantagesLimitationsCommon LocationsBulk liquid oxygen99.5%+High-purity and variable demandHigh purity, fast installation, scalable deliveryLogistics risk, price volatility, tank rentalPorts, industrial corridors, urban manufacturingPipeline oxygenUsually high purityIndustrial parks and clustersLarge volume, continuous flow, low handlingLimited geography, long contractsSteel parks, petrochemical zones, refineriesCylindersHigh purity availableSmall users and backupPortable, simple, no plant installationHigh cost per Nm3, handling workloadWorkshops, laboratories, maintenance teamsTube trailersHigh purity availableTemporary high-pressure needMobile bulk gas optionTransport dependent, limited storageRemote construction and commissioning sitesPSA oxygen plantTypically 90% to 95%Small to medium continuous useCompact, automated, lower logistics exposureNeeds power and maintenanceWastewater, medical support, small furnacesVPSA oxygen plantTypically 80% to 94%Large industrial base loadLow energy use, large scale, flexible loadRequires engineering integrationSteel, glass, paper, chemicals, metallurgyThis table shows why oxygen selection should begin with process requirements rather than supplier branding. A high-purity process may justify liquid oxygen, while oxygen-enriched combustion, blast furnace enrichment or pulp oxidation may obtain better economics from on-site generation.Selecting an industrial oxygen supplier is a strategic decision because oxygen affects production rate, energy efficiency, combustion quality, environmental performance and plant safety. Large users should build a cross-functional evaluation team involving process engineers, procurement, finance, energy management, safety, operations and maintenance. The team should compare technical capability, project experience, lifecycle cost, delivery model and support coverage.For global manufacturers operating across regions such as North America, Europe, the Middle East, Southeast Asia, India, Latin America and Africa, supplier selection should also reflect local infrastructure. A plant near Los Angeles, Hamburg or Busan may have more liquid oxygen choices than a mill in an inland mining province or a glass furnace far from a gas hub. In countries with congested roads, seasonal storms, port delays or power market volatility, a backup plan is essential.The supplier should prove experience in similar industries. Steel oxygen enrichment is different from glass oxy-fuel combustion, and paper bleaching is different from chemical oxidation. Ask for operating references, energy consumption data, adsorbent lifetime records, equipment layout drawings, startup procedures, automation logic and maintenance schedules. For an EPC or turnkey on-site plant, the supplier should define the scope clearly: air intake, blowers, vacuum pumps, adsorbers, valves, oxygen buffer, analyzer, control system, compressor if needed, cooling, civil interface, electrical interface and commissioning.Financial comparison must include more than the oxygen price. Bulk oxygen contracts may include minimum take-or-pay volumes, tank rental, delivery surcharges, demurrage, vaporizer maintenance, telemetry fees and emergency delivery premiums. On-site generation includes capital cost, power, cooling water if any, adsorbent replacement, spare parts, service labor and backup oxygen. The correct metric is total oxygen cost over five to fifteen years, adjusted for uptime value and risk.Evaluation AreaQuestions to AskWhy It MattersRisk if IgnoredTechnical fitCan the supplier meet flow, purity and pressure continuously?Protects production stabilityFurnace instability or process underperformanceReference projectsHas the supplier delivered similar capacity and industry cases?Shows practical experienceCommissioning delays and design errorsEnergy performanceWhat is guaranteed kWh per Nm3?Energy is a major lifecycle costUnexpected operating expenseRedundancyWhat happens during maintenance or power outage?Maintains operational continuityProduction shutdownCommercial termsAre there escalation, minimum volume or rental clauses?Prevents hidden costLong-term contract burdenService capacityIs remote support and spare-part delivery available?Speeds recoveryLong downtime during failuresSafety complianceAre oxygen-clean materials and procedures used?Prevents fire and contamination hazardsSafety incident or regulatory failureA strong supplier should be transparent with guarantees and boundaries. If a vendor promises a low price but avoids discussing turndown, oxygen loss, backup design or maintenance responsibility, the buyer should treat the offer cautiously.The central decision for many industrial users is whether to keep purchasing liquid oxygen or invest in on-site oxygen generation. Liquid oxygen procurement is simple at the beginning because the supplier provides storage tanks and deliveries. It is also preferred where ultra-high purity is essential or demand is irregular. However, as consumption rises, the delivered cost and logistics exposure often become decisive disadvantages.On-site VPSA/PSA plants convert ambient air into oxygen at the facility. VPSA uses vacuum pressure swing adsorption and is especially attractive for large oxygen flows with moderate purity. PSA uses pressure swing adsorption and is often selected for compact installations. Both methods use adsorbents to separate nitrogen from air, producing oxygen-rich gas without cryogenic liquefaction. Because no long-distance liquid transport is needed, energy and logistics costs may fall significantly.Modern VPSA systems can start quickly, adjust output across a broad load range and operate with stable purity. For steel and glass users, the ability to follow furnace load from partial to full capacity is valuable. Some advanced systems can operate at energy consumption below 0.3 kWh per Nm3 under suitable conditions, giving strong economics where electricity prices are reasonable. When oxygen demand is continuous, the payback period can be attractive compared with years of liquid oxygen purchases.However, on-site generation is not automatically the best answer for every plant. Buyers must consider available space, electricity reliability, discharge pressure, process purity, internal maintenance capability and financing. If high pressure is required, oxygen compression must be included. If the plant cannot tolerate any interruption, backup liquid oxygen tanks or cylinder manifolds should remain part of the system.The line chart illustrates a realistic long-term rise in industrial oxygen demand driven by steel decarbonization measures, non-ferrous metallurgy, glass efficiency upgrades, chemical oxidation, wastewater treatment and growth in emerging manufacturing regions. Growth is not uniform, but the direction favors more resilient and efficient supply models.Steel producers are among the world’s largest oxygen users. Oxygen is used in blast furnace enrichment, basic oxygen furnaces, electric arc furnace lancing, reheating, cutting and off-gas treatment. In major steel regions such as Tangshan, Jamshedpur, Duisburg, Pohang, Monterrey and the Great Lakes area, reliable oxygen supply directly affects productivity. Large VPSA oxygen systems can support oxygen-enriched blast furnace operation, improving combustion intensity and reducing fuel consumption. Integrated steel plants may also combine oxygen generation with by-product gas utilization projects to improve resource efficiency.Glass manufacturers use oxygen for oxy-fuel combustion, furnace boosting, melting quality improvement and emission reduction. Oxygen-enriched combustion can reduce nitrogen ballast in the flame, raising temperature and lowering flue gas volume. In container glass, float glass, fiberglass and specialty glass, oxygen strategy affects furnace life, NOx emissions and fuel efficiency. Sites near ports may use liquid oxygen, while continuous inland furnaces often evaluate on-site generation for cost control.The paper and pulp industry uses oxygen in delignification, bleaching, black liquor oxidation, wastewater treatment and odor control. Oxygen purity requirements are typically less extreme than in some chemical synthesis processes, making on-site generation attractive. In regions with large pulp production such as Scandinavia, Brazil, Canada, Indonesia and Chile, stable oxygen availability helps mills reduce chemical consumption and improve environmental compliance.Chemical industries use oxygen for oxidation, gasification, synthesis gas adjustment, wastewater treatment, catalyst regeneration and off-gas processing. Some applications demand very high purity, while others accept lower purity oxygen if flow and pressure are stable. Chemical parks in Houston, Antwerp, Jubail, Singapore, Ningbo and Gujarat often have pipeline or liquid oxygen options, but on-site plants remain relevant when the process requires dedicated control or when supply independence is a priority.The bar chart compares oxygen demand intensity by sector. Steel and chemicals generally consume the highest volumes, while glass, paper and non-ferrous users often show strong economic gains from combustion optimization and process stabilization.IndustryMain Oxygen UsesTypical Supply PreferenceKey Buying PriorityOperational ConcernSteelBlast furnace enrichment, BOF, EAF, lancingVPSA, cryogenic, pipelineLarge flow and reliabilityProduction loss during oxygen shortageGlassOxy-fuel combustion, furnace boostingVPSA or liquid oxygenStable flame and fuel savingFurnace temperature variationPaperDelignification, bleaching, wastewaterPSA/VPSACost and environmental complianceProcess chemistry balanceChemicalsOxidation, gasification, catalyst regenerationPipeline, liquid, on-sitePurity and safetyReaction controlNon-ferrous metalsSmelting, enrichment, refiningVPSA or liquid oxygenCombustion intensityDust and high-temperature operationWastewaterAeration and advanced oxidationPSA oxygenLow operating costSeasonal load swingsEnergy and gasificationGasification and syngas processingCryogenic or integrated on-sitePressure and purityComplex process integrationThe same oxygen molecule creates different value in each industry. Therefore, supplier evaluation should be industry-specific, with guaranteed performance tied to the user’s production metrics.Industrial oxygen specifications should be written clearly in engineering units. A common mistake is to request “industrial oxygen” without defining the exact purity, normal flow, peak flow, pressure at battery limit, dew point, allowable fluctuation and operating schedule. This leads to proposals that are difficult to compare. Buyers should specify Nm3/h, kPa or bar(g), oxygen percentage by volume, load range, startup time and analyzer location.For steel oxygen enrichment, purity between 80% and 94% may be acceptable for many enrichment applications, while BOF operations often use high-purity oxygen from cryogenic or pipeline systems. Glass oxy-fuel combustion can often work with oxygen around 90% or higher depending on burner design, furnace configuration and product quality requirements. Paper mills may use oxygen in the 90% to 95% range for many applications. Wastewater treatment can accept a wide range if oxygen transfer and process biology are properly designed. Chemical synthesis must be reviewed case by case because contaminants, inert gas content and moisture may affect reaction selectivity or safety.Pressure is equally important. VPSA oxygen is typically produced at relatively low pressure and may require oxygen compression for certain burners, reactors or long distribution networks. PSA systems may provide higher pressure directly depending on design. Compression adds cost and energy use, so pressure should not be over-specified. A plant that truly needs 0.2 bar(g) at the burner should not be designed around 8 bar(g) unless there is a technical reason.ApplicationTypical Purity RangeTypical Flow ScalePressure ConsiderationPreferred Supply OptionBlast furnace enrichment80% to 94%Thousands to over 100,000 Nm3/hLow to medium pressure, site-specificLarge VPSA oxygen plantBasic oxygen furnaceOften 99%+Very high peak flowHigh flow and strict controlCryogenic or pipelineGlass furnace boosting90% to 95% commonHundreds to thousands Nm3/hBurner pressure requiredVPSA, PSA or liquid oxygenPulp delignification90% to 95%Medium to large flowProcess pressure dependentPSA or VPSAChemical oxidation90% to 99.5%+VariableReactor safety criticalCase-specific solutionWastewater aeration85% to 95%Small to medium flowOften low pressurePSA oxygenMetal cutting and maintenanceHigh purity commonLow intermittent flowCylinder or manifold pressureCylinders or liquid backupThis specification table is a planning guide, not a substitute for process engineering. Final design should be confirmed through process data, burner requirements, safety reviews and supplier calculations.Total cost analysis should compare delivered liquid oxygen with customer-owned on-site generation across the full project life. The buyer should calculate annual oxygen consumption, current delivered price, tank and rental fees, expected price escalation, delivery frequency, vaporization losses, minimum purchase obligations, emergency premiums and production risk. For on-site generation, include capital investment, installation, electricity, maintenance, adsorbent replacement, spare parts, service contracts, oxygen compression, backup oxygen and financing cost.A simplified example: a glass plant consuming 3,000 Nm3/h for 8,000 hours per year uses 24 million Nm3 annually. If delivered liquid oxygen costs significantly more than self-generated oxygen after power and maintenance, the annual savings can justify an on-site plant. In a steel plant consuming tens of thousands of Nm3/h, the economic leverage becomes much larger. Payback may be shortened further if the on-site system reduces production interruptions or fuel use.On-site generation ROI depends heavily on electricity price. Regions with competitive industrial power, such as parts of the Middle East, China, North America, India and Southeast Asia, may show strong returns. In regions with high electricity prices, the comparison must be more careful, but logistics savings and supply security may still justify the investment. Buyers should request sensitivity analysis at different power tariffs, plant load factors and oxygen prices.The area chart reflects a global shift: more industrial users are evaluating on-site generation because energy efficiency, carbon reporting, logistics resilience and supply chain control have become board-level concerns. The 2026 trend is especially clear in steel, glass, chemicals and environmental infrastructure.Cost ElementLiquid Oxygen DeliveryOn-Site VPSA/PSA GenerationEvaluation MethodInitial capitalLower for customer, tanks may be rentedHigher because plant is installedCompare cash purchase, leasing or financingUnit oxygen costIncludes production, liquefaction and deliveryDriven mainly by power and maintenanceCalculate cost per Nm3 at actual loadLogistics exposureHighLowAssess road, port and supplier riskPurityVery highModerate to high depending on designMatch process requirement, not habitScalabilityDelivery can increase if supplier has capacityExpansion requires modular planningForecast five to ten years of demandBackup requirementStorage tank is inherentBackup system must be designedDefine emergency operating hoursCarbon impactIncludes liquefaction and transport emissionsDepends on electricity sourceUse local grid or renewable power factorA credible ROI model should include conservative assumptions and not rely on perfect uptime. The best suppliers provide guaranteed energy consumption, realistic maintenance cost and a clear backup strategy.Oxygen shortages can stop furnaces, delay chemical batches, reduce metal output and create safety hazards. Recent global disruptions have shown that industrial gas supply chains can be affected by pandemics, extreme weather, port congestion, fuel price spikes, driver shortages, geopolitical tensions and emergency medical oxygen demand. Therefore, oxygen planning is also business continuity planning.Bulk liquid oxygen users should maintain sufficient storage days based on delivery distance and supplier reliability. Sites near busy ports such as Singapore, Rotterdam, Los Angeles, Santos or Shanghai may still face congestion or weather disruption. Inland locations should review winter road closures, bridge restrictions and regional tanker availability. Pipeline users should understand plant maintenance schedules and alternative supply routes.On-site generation users should design redundancy into the system. This may include multiple adsorption trains, spare blower or vacuum capacity, oxygen buffer tanks, backup liquid oxygen storage, emergency cylinder manifolds, dual power feeds, standby generators, remote monitoring and preventive maintenance planning. The target is not only to produce oxygen cheaply, but to keep the user’s process running during foreseeable failures.Operational continuity should define tiers. Tier one is normal operation from on-site generation. Tier two is reduced-load operation using partial plant capacity. Tier three is emergency supply from liquid oxygen or cylinders. Tier four is safe shutdown. Each tier should have alarms, operator instructions and decision limits. This is especially important for continuous furnaces where unplanned shutdown can damage refractory linings.The comparison chart does not mean one option is always superior. It shows typical strengths. Liquid oxygen wins on very high purity and simplicity, while on-site VPSA/PSA generally performs well in cost control, resilience and operational independence for continuous users.PKU Pioneer, formally Beijing Peking University Pioneer Technology Corporation Ltd., is a high-tech enterprise focused on VPSA and PSA gas separation technologies. Founded in 1999 with roots in Peking University’s College of Chemistry and Molecular Engineering, the company serves global industrial customers with oxygen generation, carbon monoxide recovery, hydrogen purification and industrial by-product gas utilization technologies. For oxygen users, the company provides EPC, turnkey and customer-owned plant solutions. It does not position these projects as BOO or on-site bulk supply services; the customer owns and controls the plant asset according to the agreed project model.Technological capabilities. PKU Pioneer develops VPSA and PSA process designs, proprietary adsorbents, catalysts and integrated control systems. Its large-scale VPSA oxygen technology covers modular units and ultra-large installations, with oxygen purity typically from 80% to 94% for many industrial applications. The company has completed more than 400 industrial projects in more than 20 countries, with total installed oxygen capacity exceeding 2 million Nm3/h. Its systems are known for fast startup, flexible load adjustment and energy-efficient operation under suitable project conditions. Readers can explore more technology details through the VPSA oxygen generation solutions page.Manufacturing capabilities. The company integrates research, engineering, adsorbent manufacturing, equipment fabrication and project delivery. This integrated model helps control quality from process design to adsorber internals, valves, skid equipment and control logic. PKU Pioneer has developed high-performance adsorbents such as PU-8 molecular sieve and maintains production bases and engineering teams supporting industrial-scale execution. Its project experience includes landmark steel oxygen systems, blast furnace gas utilization and chemical co-production projects. More project examples are available at world-class innovative industrial gas projects.Service capabilities. PKU Pioneer supports feasibility analysis, process selection, EPC and turnkey delivery, commissioning, operator training, after-sales service, operation and maintenance support, retrofit, upgrade, equipment leasing, pilot testing and consulting. The company provides responsive global communication for customers comparing liquid oxygen procurement, cryogenic air separation and customer-owned VPSA/PSA plants. Its service model is designed to help customers reduce cost, improve reliability and optimize resource use. More information about the company is available through PKU Pioneer company information, and general technology resources can be found at VPSA technology and PSA gas separation solutions.Representative achievements include large VPSA oxygen plants for steel operations, high-value blast furnace gas utilization projects and international installations such as a 10,000 Nm3/h VPSA oxygen plant in Vietnam. For very large steel customers, record-scale systems have demonstrated the practical role of on-site oxygen in improving productivity and reducing long-term operating expense. The company has also worked on projects that convert previously underused industrial gas streams into valuable chemical products, supporting sustainability and resource efficiency.The best option depends on volume, purity, pressure and risk tolerance. For continuous large-volume use with moderate purity requirements, on-site VPSA oxygen generation is often highly competitive. For very high purity or irregular consumption, liquid oxygen or pipeline supply may be better.A plant should evaluate switching when oxygen consumption is continuous, delivered liquid oxygen cost is rising, logistics are unreliable, or long-term demand is predictable. A total cost model over five to fifteen years usually reveals whether on-site generation has a strong ROI.It can replace cryogenic or liquid oxygen in applications that accept VPSA purity levels, commonly around 80% to 94%. It may not replace cryogenic oxygen where ultra-high purity above 99% is required. The process requirement should decide the technology.Steel, glass, paper, non-ferrous metals, wastewater treatment and many chemical operations can benefit. The strongest cases are continuous processes where oxygen is used every day and where logistics risk or delivered oxygen price is significant.Backup oxygen is critical for continuous production. Even a reliable VPSA or PSA plant should be supported by oxygen storage, cylinders, redundant equipment or safe shutdown procedures. Backup design should be based on the value of lost production and process safety needs.Specify the lowest purity that safely and effectively meets the process requirement. Over-specifying purity can increase cost. Include flow, pressure, dew point, load range and allowable fluctuation in the technical request.It can reduce emissions related to liquefaction and transport, especially when powered by efficient equipment or low-carbon electricity. The final carbon result depends on local grid intensity, system efficiency and avoided truck deliveries.Key trends include greater interest in customer-owned on-site plants, digital monitoring, energy optimization, modular VPSA systems, hybrid backup models, stricter carbon reporting, oxygen use in cleaner combustion and stronger supply chain resilience planning.Compare technical capability, reference projects, safety record, guaranteed performance, contract transparency, service coverage, spare parts, energy data and backup planning. Local delivery price alone is not enough for a reliable decision.PKU Pioneer can provide consultation, feasibility evaluation, customized VPSA/PSA design, EPC or turnkey customer-owned oxygen plant delivery, commissioning and after-sales service. Project inquiries can be discussed through the company’s official website and contact channels.